Fed Holds Rates in June 2026: What Kevin Warsh's First Meeting Means
At Kevin Warsh's first meeting, the Fed held rates in June 2026 — but flipped its signal toward a hike. A plain-English decode of what happened and why it matters.
You've heard "high rates are bad for stocks" — yet stocks are near record highs. Here's the plain-English why, both sides, anchored to the 2026 market.
Educational purposes only. This content does not constitute investment advice. Read our disclaimer
StockCram is not a broker-dealer, investment adviser, or financial institution. All content is for educational and informational purposes only and should not be construed as personalized investment advice. Consult a qualified financial professional before making investment decisions. Past performance does not guarantee future results.
You've been told the rule a hundred times: when interest rates go up, stocks go down. Yet here we are in mid-2026 — the Fed holding its benchmark at 3.50%–3.75%, the 10-year Treasury yield up near 4.5%, inflation still running at 4.2% — and the major stock indexes are sitting close to record highs. So why do stocks go up when interest rates are high?
This explainer answers that exact question in plain English: why high rates are *supposed* to drag stocks down (the rule is real), why that drag isn't winning right now, the "where else would the money go?" effect, and the honest bear case for why the rule may be delayed — not repealed.
No predictions, no buy or sell signals. Just the mechanism, both sides — so the next time a headline says "stocks rise despite high rates," you can tell which part of the stock-pricing equation moved: the discount rate, expected earnings, or where investors put their money. It's the sequel to our breakdown of the Fed's June 2026 decision, which raised this exact question.
Editor's Note (June 21, 2026): This is an educational explainer of a recurring market puzzle, anchored to the mid-2026 backdrop. It explains why stocks can rise while rates are high — it does not predict where stocks, rates, or yields go next, and nothing here is investing advice.
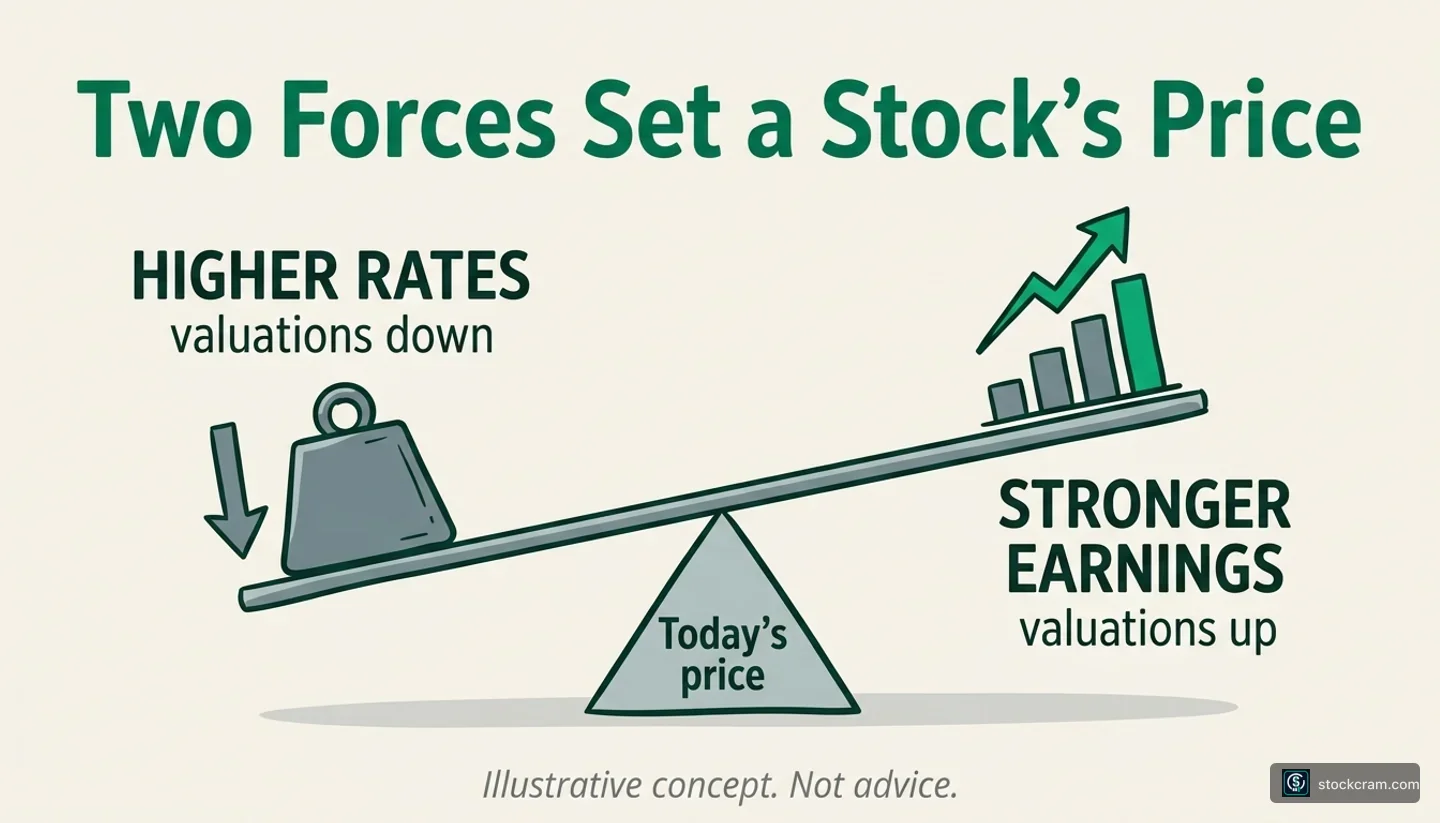
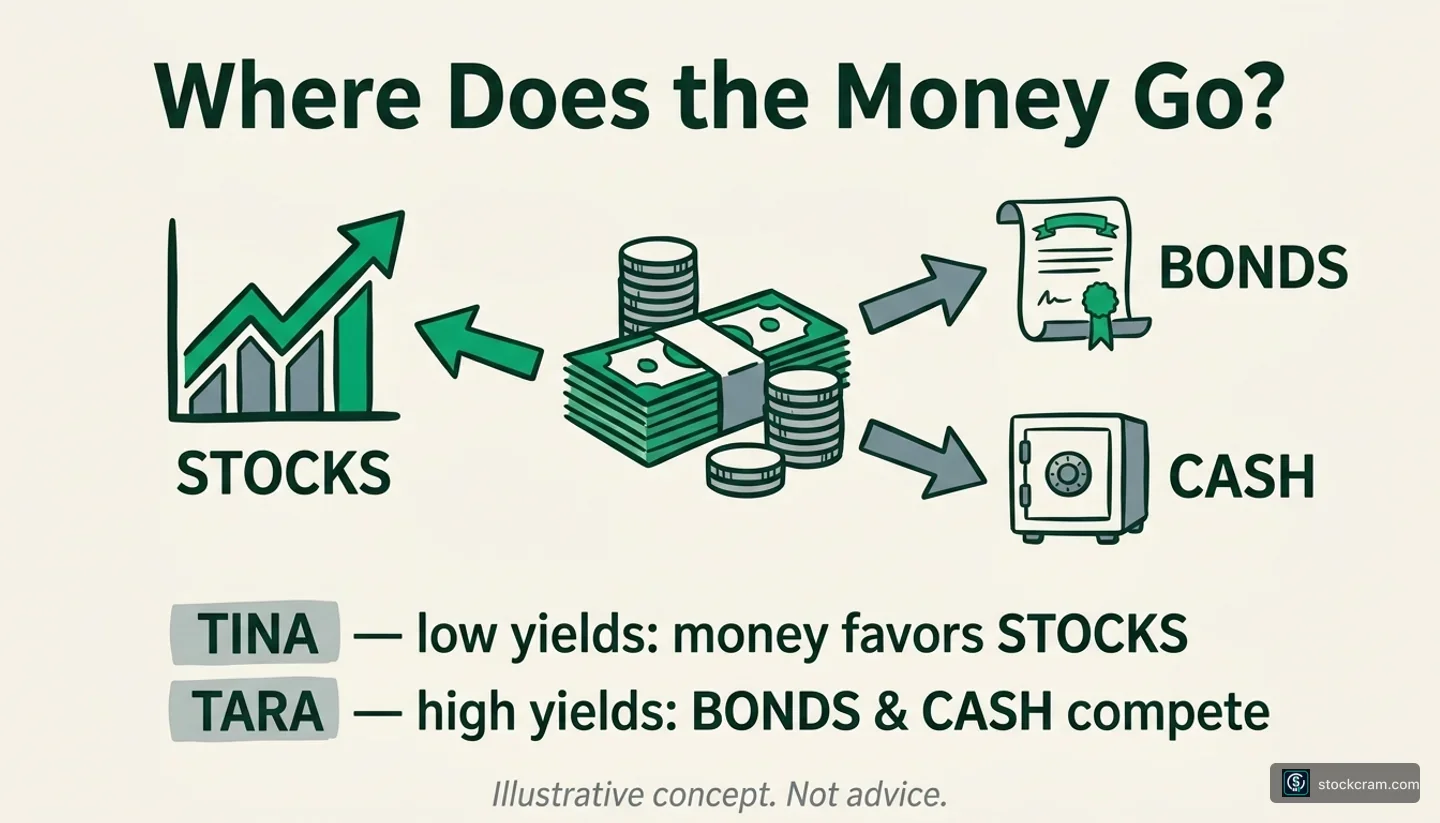
Quick answer: Stocks can go up when interest rates are high because rates are only one of several inputs into stock prices. Higher rates usually lower valuations, but if investors expect company earnings to grow faster, prices can rise anyway. Stocks can also hold up when investors still prefer equities to bonds or cash despite higher yields.
"Higher interest rates are bad for stocks" is one of the first rules of thumb a new investor learns, and it's genuinely useful — there's a real mechanism behind it (the discount-rate rule, below). But it's a tendency, not a law of physics. Rates affect the multiple investors will pay; earnings expectations affect the profits being valued; and sentiment affects both. A stock price is the result of all of them at once.
The mid-2026 backdrop (data as of mid-June 2026): the Federal Reserve held its benchmark at 3.50%–3.75% (FOMC, June 17, 2026); the 10-year Treasury yield sat near 4.5% (FRED series DGS10, mid-June 2026); annual inflation ran at 4.2% (all-items CPI-U, year over year, May 2026, BLS); and the major U.S. indexes were near record highs, up roughly 10% year-to-date (S&P 500 price index — price return, not total return — through June 19, 2026; S&P Dow Jones Indices). High rates, high yields, high stocks — all at once. Here's how that combination is possible, with the bear case included.
Start with why the rule exists. A stock is, in theory, worth all the profits a company will earn in the future — but a dollar of profit ten years from now is worth less to you than a dollar today. To compare future dollars to today's dollars, investors shrink them using a discount rate. The higher that rate, the more those far-off profits get shrunk.
The link to interest rates: the discount rate is built on top of "safe" returns like Treasury yields. When the Fed holds short-term rates high and the 10-year Treasury yields around 4.5%, the discount rate applied to stocks rises too. Shrink future profits harder, and the price you'd pay for them today falls. That's the textbook "rates up, stocks down."
A quick example (illustrative only). Say a company is expected to earn $100 ten years from now. At a 3% discount rate, that $100 is worth about $74 today; at a 5% discount rate, only about $61. Nothing about the business changed — only the rate — yet its present value dropped by roughly 18%. That single mechanic is why higher rates can lower valuations, and why it bites hardest on companies whose profits sit far in the future. A steady utility earns most of its profit soon; a fast-growing tech company is valued mostly on profits expected years out, so it gets marked down the most when yields jump.

Higher rates reduce the present value of future profits; higher expected profits can offset that. Illustrative concept, not a forecast.
So far, this all argues for stocks falling when rates rise. The reason they've often done the opposite sits on the other side of the equation: expected earnings.
Illustrative comparison of the simple rule against the 2026 backdrop. Sources: FOMC statement June 17, 2026; FRED DGS10 (mid-June 2026); BLS CPI-U (May 2026); S&P Dow Jones Indices S&P 500 price index (price return through June 19, 2026). Market levels approximate; past performance does not indicate future results.
| Factor | The Rule Says | What Happened 2026 |
|---|---|---|
| Fed benchmark rate | High & restrictive → headwind for stocks | Held 3.50%–3.75%, yet indexes near record highs |
| 10-year Treasury yield | ~4.5% → higher discount rate → lower valuations | Elevated, but stocks up ~10% year-to-date |
| Inflation (CPI) | 4.2% → keeps rates high → pressure | Sticky, but one interpretation is that earnings expectations offset part of the drag |
| Net effect on stocks | Should fall | Rose — investors gave the earnings story more weight |
The part beginners miss is that Wall Street can change both sides of the equation at once: the numerator (expected future profits) and the denominator (the discount rate). A higher discount rate shrinks future profits — but if investors raise their estimate of those profits at the same time, the two can offset, and growth can come out ahead.
Extend the earlier example. That same $100-in-ten-years company is worth about $61 today at a 5% rate. But suppose analysts now expect it to earn $130 instead of $100 — at the same 5% rate, it's worth about $80 today, more than the $74 it was worth at a 3% rate on the old estimate. The rate rose, yet the value rose too, because the growth estimate rose faster. That's the counterintuitive part: a higher rate can still produce a higher present value when the profit estimate rises faster (the table below makes it concrete).
That mechanic is the cleaner read on the 2026 rally. Even with the Fed restrictive and yields high, one widely cited market narrative focused on rising earnings expectations in large technology companies and AI-linked spending. Some strategists describe the backdrop as a "no-landing" scenario: the economy keeps growing and earnings keep expanding instead of stalling. Long-term yields reflect expectations for future short-term rates, inflation, and a term premium (extra yield for locking up money longer). For stocks, the key question is whether expected earnings growth and risk appetite are strong enough to offset that higher discount rate.
None of this guarantees the growth keeps coming — that's the bear case, next. But the mechanism is clear: through mid-2026, index prices put more weight on earnings growth than on the rate drag.
See the mechanics yourself. Our foundations course walks through how a stock's value is built from its future profits — the same present-value idea, step by step.
A simplified present-value example using a single profit expected in 10 years. Illustrative mechanics only — not a valuation, forecast, or advice.
| Scenario | Worth Today | Discount Rate | Expected Profit In 10 Years |
|---|---|---|---|
| Base case | ≈ $74 | 3% | $100 |
| Rate rises only | ≈ $61 — the rate drag wins | 5% | $100 |
| Rate rises, but growth rises too | ≈ $80 — growth offsets the higher rate | 5% | $130 |
There's a wrinkle that explains a lot of 2026: the S&P 500 is market-cap weighted, so the biggest companies move it the most. A handful of mega-cap technology and AI-linked companies can pull the whole index up — or down — almost on their own.
That means "stocks are up" doesn't always mean "all stocks are up." It can mean the largest companies did enough to outweigh weakness elsewhere. Concentration has been historically high: RBC Wealth Management noted the 10 largest companies made up nearly 41% of the S&P 500 by the end of 2025. When a few names carry an outsized share of the index's market cap and of expected earnings growth, strong results from those few can lift the index even while higher rates weigh on smaller, more rate-sensitive companies.
This cut both ways in mid-2026: on days when a few large technology names sold off, the cap-weighted S&P 500 could slip even while smaller companies — tracked by small-cap gauges like the Russell 2000 — held up or rallied. So when you read "the market is up (or down) despite high rates," it's worth a third question alongside earnings and yields: is this the whole market, or mostly the mega-caps? The index headline and the typical stock don't always tell the same story.
There's a second force, nicknamed TINA — "There Is No Alternative." The TINA effect, explained simply: market prices reflect tradeoffs among stocks, bonds, and cash. When the safe options pay almost nothing, some investors may demand less compensation for owning equities, which can support valuations. That dynamic helped support the long bull market of the 2010s, when cash and bonds yielded close to zero.
The nuance for a high-rate world like 2026: with cash and bonds paying something real again, the pure TINA argument is weaker. That's part of the bear case — safe assets finally compete. But a softer version can persist. If investors still expect stocks to offer a higher risk-adjusted payoff than bonds or cash, equity valuations can stay supported even when bonds yield 4%–5%. The technical name for that expected edge is the equity risk premium: the extra return investors want for holding stocks instead of safe bonds.

Market prices reflect tradeoffs among stocks, bonds, and cash. When investors expect stocks to out-earn safe assets, valuations can stay supported even at higher rates. Illustrative concept, not advice.
The table contrasts the two regimes: the low-rate world where TINA dominates, and the higher-rate world (like 2026) where its mirror image — sometimes called "TARA," There Are Reasonable Alternatives — competes for attention.
Illustrative framework, not advice. "TINA" and "TARA" are informal market shorthand, not technical terms.
| Regime | Environment | Investor Logic | Effect On Stocks |
|---|---|---|---|
| TINA — "There Is No Alternative" | Rates & yields near zero (e.g., the 2010s) | Safe assets pay almost nothing | Fewer low-risk sources of yield; equities may look relatively more attractive to some investors |
| TARA — "There Are Reasonable Alternatives" | Rates & yields elevated (e.g., 2026) | Bonds & cash pay 4%–5% again | Stocks face more competition from bonds and cash; support depends on expectations for earnings growth, risk premiums, and valuations |
Much of the confusion here comes from blurring two different numbers. The Fed's benchmark rate (3.50%–3.75% in mid-2026) is a short-term rate the central bank sets directly. A bond yield — like the ~4.5% on the 10-year Treasury — is set by the market, and reflects what investors expect rates and inflation to do over years, plus a term premium for locking money up.
Why it matters: long-term yields, not the Fed's overnight rate, feed most directly into the discount rate for stocks (and into mortgage rates). The Fed can hold steady while the 10-year yield drifts up or down on its own — so "stocks rising despite high yields" and "stocks rising despite the Fed" are related but distinct. For what the Fed actually controls, see why the Fed's independence matters to markets; for how rate expectations ripple outward, see the value of the dollar. Definitions of yield, the federal funds rate, and the yield curve live in the glossary and the Market Explainers series.
The bear case starts with a simple objection: rising stocks do not prove that high rates stopped mattering. They can also mean the effects haven't fully arrived.
Valuations are stretched. One widely watched gauge, the cyclically adjusted price-to-earnings (CAPE) ratio, sat around 40–42 in mid-2026 (the exact figure varies by source and update timing) — territory seen only around the dot-com peak of 2000 (Shiller CAPE; e.g., Multpl and GuruFocus). High valuations don't predict when anything happens, but historically they've meant investors were paying a lot for each dollar of earnings, leaving less margin for error if growth disappoints. (Historical data shown; past performance does not indicate future results.)
High rates work with a lag. Restrictive rates slow the economy gradually — through mortgages, business loans, and refinancing — often over many quarters. The economic effects of high rates may not have fully shown up in earnings and credit conditions yet, especially if the "no-landing" story falters. The equity risk premium is thin when stocks are expensive and bonds yield 4%–5%: investors are getting paid relatively little extra to take stock-market risk, which some analysts flag as a caution sign.
The rule isn't repealed — it's one force being outvoted. If earnings expectations cool while rates stay high, the discount-rate drag that's currently losing could win. That is not a forecast — it's the same valuation mechanism working in the opposite direction. The same forces that can let stocks rise despite high rates can let them fall when the growth story fades, which is why honest market education holds both possibilities at once.
Yes — and that history is the best antidote to treating "rates up, stocks down" as a law. When rates rose because the economy was strong and earnings were growing, stocks often rose alongside them. When rates spiked because inflation was out of control and the future looked uncertain, stocks tended to struggle. Same direction of rates, opposite outcome — because why rates are rising matters as much as that they are.
The table below shows a few illustrative stretches with approximate rate moves. Historical episodes differ mainly by their inflation and earnings context, and there is no fixed link where a higher rate always means a lower market. The 2026 backdrop — high rates, high yields, stocks near records — is unusual, but not unprecedented.
Broad historical eras for U.S. large-cap stocks, illustrative and not controlled studies; changing the start or end date changes the result. Sources: Fed funds effective rate (FRED FEDFUNDS); S&P 500 price index and inflation-adjusted data (Robert Shiller, Yale). Direction is approximate; nominal unless 'real' is stated. Past performance does not indicate future results.
| Period | Stocks | What Drove It | Approx Rate Move |
|---|---|---|---|
| 1950s–1960s | Rose (nominal) | Strong post-war growth and earnings outweighed rising rates | Short-term rates ~1% → ~5%+ |
| Mid/late 1970s | Weak in real (inflation-adjusted) terms | Rates rose on out-of-control inflation; growth uncertain | Fed funds spiked toward double digits |
| Jan 2004 – Jun 2006 | S&P 500 price index rose into 2007 | Economy and earnings expanded while the Fed tightened | Fed funds ~1% → ~5.25% |
| Mid-2020s (2026) | Near record highs | Investors weighed earnings growth (tech/AI) over the rate drag | Held 3.50%–3.75%; 10-yr ~4.5% |
Don't try to guess which side is "right" from a single headline. First separate the headline into its two drivers. When you next see "stocks rise despite high rates," ask two concrete questions:
1. Did expected earnings change? If analysts have raised expected future profits enough to offset the higher discount rate — or the economy looks resilient — that's the earnings side at work. Stocks rising while the 10-year yield is also rising usually points here.
2. Did long-term yields move? Stocks rising while the 10-year yield falls is a different story from stocks rising while it climbs. Much of the "despite high rates" action is really about long-term yields and the term premium, not the Fed's next move — so separate the two before drawing a conclusion.
The cleanest reading keeps those variables separate: earnings expectations explain the rise, and stretched valuations plus lagged rate effects explain the risk. Rather than "stocks always win" or "a crash is coming," one reading is that prices have reflected stronger earnings expectations so far, and a stall in those expectations is what would change it.
Want to keep decoding market headlines without the jargon? StockCram Foundations walks through how a stock is valued and how rate changes move that value, step by step — sign in to save lessons and track your progress as you go. Then follow the Market Explainers series for live context, starting with the Fed's June 2026 decision.
Most "stocks up, rates high" headlines come down to three forces:
A plain-English summary of the mechanics in this article. Educational framework only — not advice or a forecast.
| Force | Direction | What It Does |
|---|---|---|
| 1. Discount rate | Headwind for stocks | Higher rates raise the discount rate, lowering the present value of future profits |
| 2. Earnings estimate | Tailwind for stocks | Higher expected future profits raise what a stock is worth today |
| 3. Alternatives (TINA / TARA) | Either way, depending on yields | What bonds and cash pay sets how attractive stocks look by comparison |
Common questions about why stocks rise when interest rates and bond yields are high.
Market levels and rates referenced are approximate, as of mid-June 2026, and are used for educational illustration. The mechanics in this article are evergreen; the specific figures are a current example and are updated when Fed policy, 10-year yields, CPI, or S&P 500 levels change materially.
Educational content only. StockCram is not a broker-dealer, investment adviser, or financial institution, and nothing here is investment advice or a recommendation to buy or sell any security. Historical data is shown for context; past performance does not indicate future results.
The discount-rate rule is real but not a law
Higher rates raise the discount rate and lower the present value of future profits — a genuine headwind, especially for high-growth stocks — but it's one force among several.
Earnings-growth expectations can count for more than the rate drag
If investors raise their estimate of future profits faster than rates rise, prices can climb anyway — a $130 estimate at 5% can be worth more today than $100 at 3%. In 2026, that interpretation fit a market led by tech and AI.
The TINA effect can support equity valuations
When bonds and cash pay little, valuations tend to stay supported. Higher rates flip this toward "TARA," but a softer version persists if investors still expect stocks to out-earn safe assets.
Fed rate and bond yields are different numbers
The Fed sets a short-term rate; the market sets long-term yields. Long-term yields drive the discount rate for stocks and can move on their own, independent of the Fed.
The bear case is delay, not repeal
Stretched valuations (CAPE around 40–42, a dot-com-era level) and lagged rate effects mean the same mechanism could push stocks down if growth expectations cool.
At Kevin Warsh's first meeting, the Fed held rates in June 2026 — but flipped its signal toward a hike. A plain-English decode of what happened and why it matters.
When war fears ease, oil often falls while stocks rise. Here's the simple mechanic behind it — taught through the June 2026 Iran ceasefire.
SpaceX priced its IPO at $135/share for a record $75B raise — first trade June 12. Here's the lockup schedule, retail-fill math, Day-1 mechanics, and both sides of the valuation debate.
Because interest rates are only one of several forces setting stock prices. Higher rates do raise the discount rate, which lowers the present value of future profits — a genuine headwind. But if investors raise their expectations for those future profits at the same time (as many investors appeared to do in 2026, led by tech and AI), the earnings side can count for more than the rate drag and lift stocks anyway. Stocks aren't ignoring high rates; they're weighing the growth side of the equation more heavily.
No. "High rates hurt stocks" is a strong tendency, not a law. History shows rates and stocks have risen together when the economy and earnings were strong (e.g., the 1950s–60s and 2004–2006), and diverged when rates rose because inflation was out of control (the late 1970s). Why rates are rising matters as much as the fact that they are. The discount-rate drag is always present, but it competes with growth, inflation expectations, and where else money can go.
TINA stands for "There Is No Alternative." It describes periods when low bond and cash yields can make equities look relatively more attractive to some investors, which may support valuations — a dynamic often cited for the 2010s bull market. With rates higher in 2026, the pure TINA argument is weaker (bonds and cash now pay something), but a softer version persists if investors still expect stocks to out-earn safe assets over time. The opposite idea is sometimes called TARA: "There Are Reasonable Alternatives."
As of mid-2026, the major U.S. indexes have been near record highs even with the Fed holding at 3.50%–3.75% and the 10-year Treasury yielding around 4.5%. The cleaner read is that investors' expectations for earnings growth — concentrated in large technology companies and the AI buildout — mattered more than the drag from higher rates. (Because the index is market-cap weighted, those mega-caps carry outsized influence.) This is context, not a prediction: valuations are also stretched (the CAPE ratio sat around 40–42, a dot-com-era level), which is the bear case. Past performance does not indicate future results.
Bond yields (like the ~4.5% 10-year Treasury) are set by the market and feed the discount rate used to value stocks, so elevated yields are a real headwind. Stocks can rise anyway when investors appear to place more weight on earnings growth than on the rate drag. It also helps to remember that long-term yields can move on their own, separate from the Fed's short-term rate — so "despite high yields" and "despite the Fed" are related but distinct puzzles.
No one knows, and anyone who claims certainty is guessing. The honest framing is symmetric: the same mechanism that lets stocks rise despite high rates (growth expectations counting for more than the rate drag) can let them fall if those growth expectations cool while rates stay high. High rates also work with a lag, and stretched valuations leave little margin for error. This is educational context about how the mechanism works — not a forecast or advice.
The Fed's benchmark rate (3.50%–3.75% in mid-2026) is a short-term rate the central bank sets directly. A bond yield, like the 10-year Treasury's ~4.5%, is set by the market and reflects expectations for rates and inflation over years, plus a term premium for locking up money. Long-term yields — not the Fed's overnight rate — feed most directly into the discount rate for stocks and into mortgage rates, which is why the Fed can hold steady while yields move on their own.
It's the same puzzle in plain words. Through 2026 the broad market climbed to near record highs even with high rates, and the most common explanation is that investors gave more weight to earnings growth — especially at large technology and AI-linked companies — than to the drag from higher rates. Because the S&P 500 is market-cap weighted, a handful of mega-caps can lift the whole index, so "the market" rising doesn't always mean every stock is. None of this is a prediction — markets can and do fall, and past performance does not indicate future results.