
Why Do Stocks Go Up When Interest Rates Are High?
You've heard "high rates are bad for stocks," yet stocks are near record highs. Here's the plain-English why, both sides, anchored to the 2026 market.
19 min read
Read Article
Is the housing market crashing in 2026? The truer answer: it's frozen, not crashing. The lock-in effect, both sides, in plain English.

Educational purposes only. This content does not constitute investment advice. Read our disclaimer
StockCram is not a broker-dealer, investment adviser, or financial institution. All content is for educational and informational purposes only and should not be construed as personalized investment advice. Consult a qualified financial professional before making investment decisions. Past performance does not guarantee future results.
Ask around and you'll hear two things at once: "nobody can afford a house," and "is the housing market about to crash?" Listings are thin, friends who'd love to move won't sell, and prices still feel impossible. So is the housing market crashing in 2026? The more accurate answer is also more useful: it looks less like a price crash than a freeze.
This explainer answers the question everyone's typing (*is the housing market crashing?*) in plain English. We'll separate a crash from a freeze, walk through the lock-in effect that froze it, why mortgage rates are even this high, the affordability squeeze, what's quietly thawing in 2026, and the honest case for what could still go wrong.
No predictions, no "now is a good/bad time to buy": just the mechanism, both sides. It's part of our Market Explainers cluster, and it connects directly to the rates story: the same high interest rates behind why stocks rose despite high yields are what froze housing.
Update (October 9, 2026): Mortgage rates kept climbing: Freddie Mac reported the 30-year at 7.40% for the week ending October 8, up from 7.28% on October 1. The 10-year Treasury yield eased to around 5.23% by October 9, down from peaks above 5.34% earlier in the week. September inventory data showed active listings at approximately 1.16 million (FRED/Realtor.com), up from 1.10 million in June. The September existing-home sales report arrives October 13. Rates remain elevated, and the freeze pattern continues.
Editor's Note (July 2026): This is an educational explainer of a recurring question, anchored to the mid-2026 market. It explains why housing feels stuck. It does not predict home prices or mortgage rates, and nothing here is buying, selling, or investing advice.
Quick answer: In mid-2026, the U.S. housing market wasn't showing a classic crash (sharp price declines and forced selling). A better description is a freeze. Sales are low, affordability is poor, and owners holding cheap pandemic-era mortgages (the lock-in effect) aren't listing, so prices stayed roughly flat rather than falling.
A crash is a price event. A freeze is a volume event. You can have a market where it's painfully hard to buy (few listings, brutal monthly payments) without prices actually collapsing, and that's largely what 2026 looks like. The rest of this article explains how that combination is even possible, what's started to thaw, and the honest case for what could still tip it toward a real downturn.
Approximate latest figures for orientation. Sources: Freddie Mac, FRED, NAR, Realtor.com, U.S. Census/HUD. Figures change continuously; past performance does not indicate future results.
| Gauge | Latest |
|---|---|
| 30-year mortgage rate | ~7.40% (Freddie Mac, week ending Oct. 8, 2026) |
| 10-year Treasury yield | ~5.23% (Trading Economics, Oct. 9, 2026; peaked above 5.34% in early Oct.) |
| Existing-home sales | ~3.98M annualized (NAR, August 2026; released Sep. 10) |
| Existing-home inventory | ~1.62M units / ~4.9 months (NAR, August 2026) |
| Active listings (Realtor.com) | ~1.10M (June 2026; +1.9% YoY, ~9.6% below June 2019) |
| New-home supply | ~10.3 months (U.S. Census/HUD, May 2026) |
When people ask "is the housing market crashing," they usually picture 2008: prices falling 20–30%, foreclosures everywhere, owners underwater on loans worth more than their homes. That was a genuine crash, driven by risky lending, oversupply, and forced selling.
A freeze is a different animal. Prices don't collapse; transactions do. Homeowners stop listing, buyers pull back because payments are unaffordable, and the whole market slows to a crawl. Inventory stays thin, bidding can still be competitive on the few good listings, and prices drift sideways instead of falling off a cliff. By most measures, the mid-2020s market is a freeze, not a crash: existing-home sales fell to multi-decade lows while national prices kept inching up.
Why the confusion? Because a freeze feels like a crisis from the inside: you can't find anything, what you find you can't afford, and the market seems broken. But unaffordable is not the same as crashing in price. Knowing which one you're looking at is the difference between panic and understanding.
Illustrative comparison of a housing crash versus a housing freeze. Educational framework, not a forecast.
| Feature | Crash | Freeze |
|---|---|---|
| What moves | Prices fall sharply | Sales volume dries up; prices roughly flat |
| Driver | Forced selling, risky lending, oversupply | Lock-in effect + unaffordable rates, few listings |
| Inventory | Floods the market | Stays thin (owners won't sell) |
| Classic example | 2008 financial crisis | The mid-2020s rate shock |
| How it feels | Falling values, foreclosures | Can't find or afford anything |
The engine of the freeze is the lock-in effect, sometimes called the housing market's "golden handcuffs." Here's the math: during the pandemic, mortgage rates fell near 3%, and tens of millions of owners either bought or refinanced into those ultra-cheap loans. To move now, they'd have to give up that 3% loan and take on a new one at today's much higher mortgage rate, so most simply stay put.
A quick example (illustrative only). Take a $300,000 mortgage. At 3%, the monthly principal-and-interest payment is about $1,265. At a mid-2026 rate around 6.5%, the same loan runs about $1,896, roughly $630 more a month, or about a 50% jump, for the exact same house. Multiply that across a move (often into a pricier home), and the payment math simply doesn't work for a huge share of would-be sellers. So they don't list.
The infographic below shows the golden handcuffs in one picture: the same loan, two very different monthly payments.
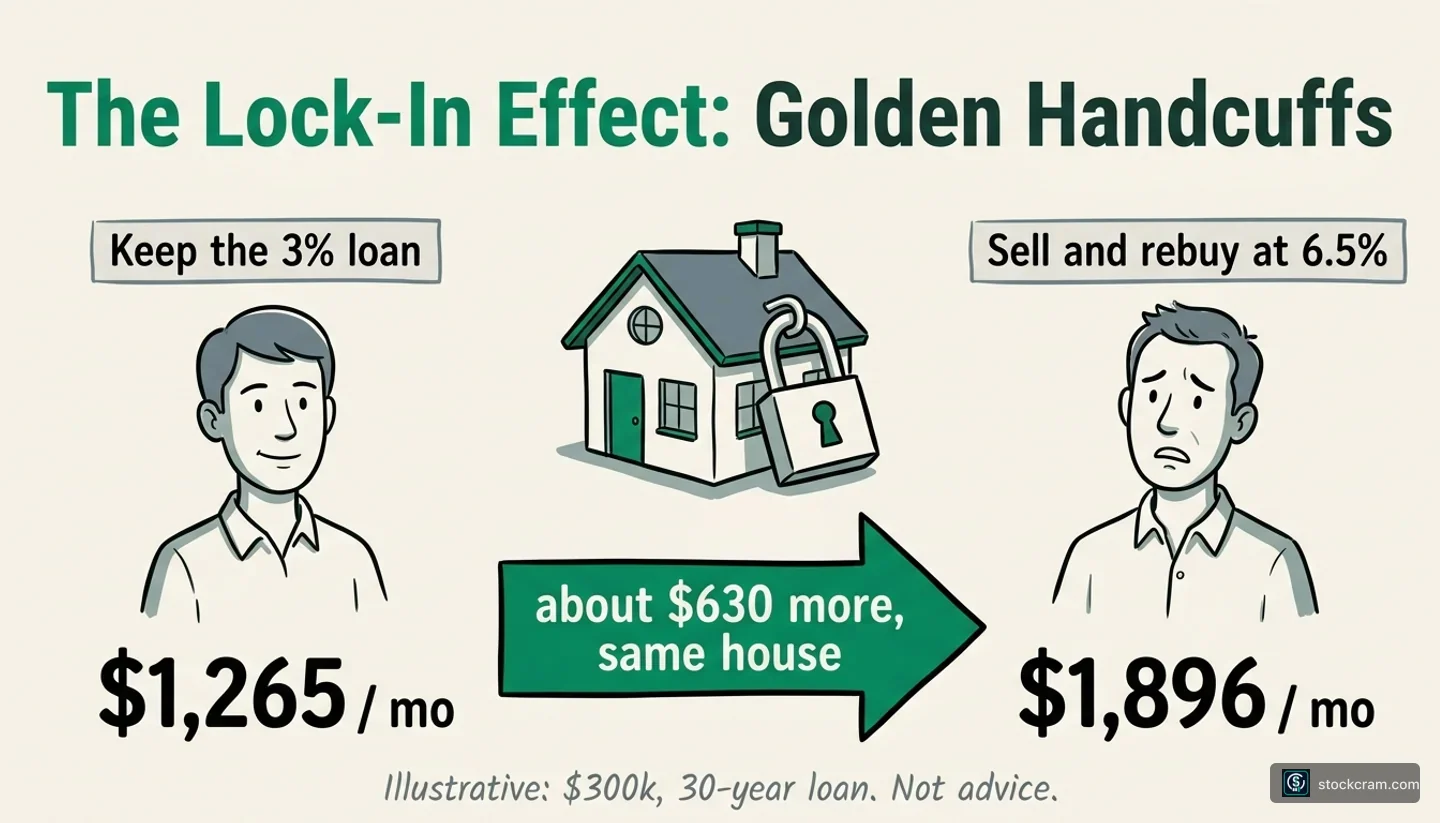
The lock-in effect: trading a ~3% loan for a ~6.5% one can add hundreds a month for the same house, so owners stay put and inventory freezes. Illustrative figures; not advice.
The scale is enormous. FHFA researchers estimated that mortgage-rate lock-in prevented about 1.72 million home sales between mid-2022 and mid-2024 (2022 Q2–2024 Q2). That's a huge drag on normal turnover, and by choking supply it actually pushed prices up roughly 7% (FHFA Working Paper 24-03). Their rule of thumb: for every percentage point that today's rate sits above a homeowner's locked-in rate, the odds of a sale drop about 18%. When that many owners refuse to sell, housing inventory collapses, and a market can freeze solid even though nothing is technically "wrong" with home values.
Curious how a rate change hits the monthly payment? Our foundations course breaks down how mortgage rates and payments work. Sign in to save lessons and track the Market Explainers series.
Monthly principal-and-interest on a $300,000 30-year fixed mortgage. Illustrative only: excludes taxes, insurance, and fees; not advice.
| Mortgage Rate | Monthly Payment |
|---|---|
| 3% (pandemic-era) | ≈ $1,265 |
| 6.5% (mid-2026) | ≈ $1,896, about $630 more/month |
| 7% | ≈ $1,996 |
Here's the link most housing coverage skips: the bond market. Mortgage rates aren't set by the Federal Reserve directly. A 30-year fixed mortgage rate roughly tracks the 10-year Treasury yield (plus a spread for risk and profit). So to understand mortgage rates, you have to understand bond yields.
And bond yields are elevated because the Fed has kept policy restrictive to fight inflation. As of mid-2026, the Fed held its benchmark at 3.50%–3.75% and signaled a possible hike (and held rates at 3.50%-3.75% on July 29, 2026 (with three dissents)), while inflation cooled to 3.5% (June 2026 CPI) and the 10-year Treasury spiked to around 5% by mid-September 2026 and climbed to around 5.23% by October 9 (after peaking above 5.34% in early October, the highest since 2002), following the Fed's September 16 rate hike. That kept 30-year mortgages above 7% (Freddie Mac put the 30-year at 7.40% for the week ending October 8, 2026, up from 6.95% in mid-September), down from the ~7 to 8% peaks of 2023, but worlds away from the ~3% pandemic loans owners are clinging to.
That's the rate link behind the freeze: housing belongs in the rate story, not just the real-estate section. The same high rates that we covered in why stocks can rise even when interest rates are high are exactly what froze the housing market. And because mortgages follow long-term yields rather than the Fed's overnight rate, they can stay high even if the Fed stops hiking, which is why the freeze has lasted longer than many expected.
Related reading: why stocks rise when interest rates are high · the Fed's June 2026 decision · the weak-dollar explainer · what the lock-in effect is · what a bond yield is.
On the supply side, the lock-in effect explains why so few homes are for sale. Housing affordability explains the demand side: why even the homes that are listed feel out of reach.
Affordability combines home prices, mortgage rates, and incomes. The unusual 2020s pattern: payments kept rising even after national price growth cooled. Rates did the damage. When a mortgage rate jumps from 3% to 6.5%, the monthly payment on the same home can rise 40–50%, so a buyer's budget buys far less house, even if list prices barely moved. Layer that on top of the big price gains of 2020–2022 that never fully reversed, and you get a market where the typical buyer is priced out by the payment, not just the sticker.
The crisis is real for buyers. Affordability is near its worst in decades. A crisis of affordability is not the same as a crash in prices. Both can be true at once, and in 2026 they largely are: brutally unaffordable, yet not collapsing.
The resale market froze first, but builders had more ways to keep deals moving. The new-home market is the escape hatch the "frozen" story often skips. While existing-home sales froze under the lock-in effect, sales of newly built homes held up far better, and builders captured an unusually large share of the market. That matters because the resale market and the new-home market behaved very differently through the freeze.
An individual homeowner with a 3% mortgage has one lever (sell or don't), but a homebuilder has many. The big one is the mortgage-rate buydown. Builders can effectively pay down a buyer's mortgage rate, using their own margin or a lender partnership, to something like 5% (or lower for the first couple of years), making the monthly payment work when an existing seller simply can't match it. Builders also shrink floor plans, throw in incentives (closing-cost credits, upgrades), and build where land is available.
The result is that new construction became the freeze's pressure valve. So newly built homes took a bigger slice of total sales than usual, by some measures rising to around 30% of homes listed for sale, versus a historical norm closer to 10–15% (an approximate share comparing U.S. Census new-home and NAR existing-home inventory, 2024–2026). A meaningful chunk of 2026's inventory recovery came from builders, not from existing owners finally listing. By mid-2026 the new-home side was cooling too: new single-family home sales slipped to roughly 580,000 annualized in May 2026, down about 7% from the prior month, with new-home supply near 10 months (U.S. Census/HUD). Even builders were feeling the affordability squeeze.
The standard supply gauge, "months of supply" (how long it would take to sell every listed home at the current sales pace), tells the story. Existing homes ran at unusually low months of supply (thin resale listings, quick sales), while new homes carried more. The two halves of the market moved on different clocks. When you hear "the housing market," ask which half: the frozen resale side, or the incentive-fueled new-build side. Demand didn't vanish, it rerouted to where the payment math still worked. (Illustrative; builder incentives and new-home share vary by builder and metro.)
Some mid-2026 indicators pointed to a partial thaw, though unevenly, and the pattern could shift.
The clearest sign is the lock-in effect easing. By early 2026, FHFA National Mortgage Database data (via Realtor.com/Redfin analyses) showed the share of homeowners with rates above 6% surpassing the share with rates below 3%. As more owners hold loans closer to today's market rate, the financial penalty for moving shrinks, and they start listing again. That's showing up in inventory: active listings reached about 1.16 million in September (FRED/Realtor.com), up roughly 5.6% year-over-year, continuing the gradual thaw. Prices sent a mixed signal: closed existing-home sale prices were still positive (the median rose about 1.6% year-over-year to ~$429,100, per NAR, August 2026), while asking prices were falling (Realtor.com's median list price down about 2.4–2.5% year-over-year), a sign of normalization, not a clean crash.
The scorecard below weighs what's freezing the market against what's thawing it.
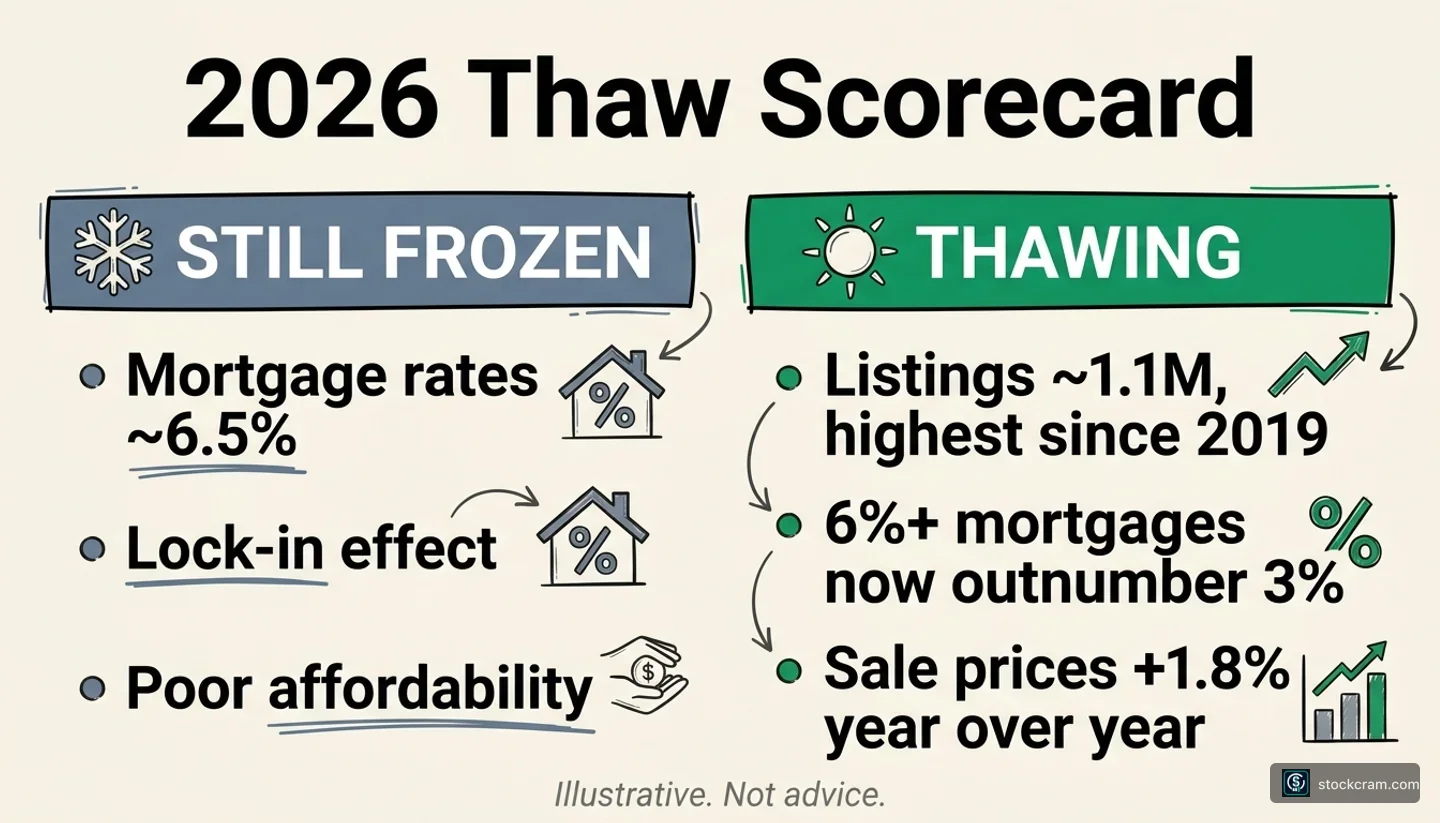
The 2026 thaw is real but partial: inventory and lock-in are easing, yet affordability stays strained. Illustrative; sources in the references. Past performance does not indicate future results.
The spring 2026 selling season underwhelmed: all the ingredients for a thaw were lined up (more listings, cooling prices), yet sales stayed sluggish because affordability is still so stretched. The mid-2026 data pointed to partial improvement, not a full normalization.
Illustrative both-sides snapshot as of mid-2026. Sources in references. Past performance does not indicate future results.
| Still Freezing | Thawing |
|---|---|
| 30-yr mortgage ~6.5% (vs ~3% locked-in loans) | 6%+ mortgages now outnumber sub-3%, lock-in easing |
| Affordability near multi-decade worst | Active listings ~1.1M, highest since 2019 |
| Spring 2026 sales underwhelmed | Sale-price growth cooled; asking prices turned negative YoY |
"Is the housing market crashing?" gets contradictory answers because there is no single housing market. There are thousands of local housing markets, and the freeze hasn't hit them equally. National figures (flat prices, frozen volume) are an average that can hide big regional gaps.
Sun Belt metros that built aggressively (parts of Texas and Florida, for example) added real supply, so some have seen actual price declines, closer to a local correction than a freeze. Supply-constrained metros (much of the Northeast, coastal California, parts of the Midwest) build very little new housing and have the tightest lock-in, so they've stayed frozen with firm prices. And the lock-in's grip itself varies: areas with more recent buyers (more 6%+ mortgages) are thawing faster than areas dominated by long-time owners still sitting on 3% loans.
The same national month can mean "prices are softening" in one metro and "nothing's for sale and bidding wars continue" in another. When you read a national "housing crash" headline, remember it's an average: it may not describe your city, let alone your block. (Local figures vary; this is general context, not advice about any specific market.)
This argument depends on distress staying contained. "Frozen, not crashing" describes today, not tomorrow. A freeze can thaw gently, or it can crack into something worse. Both camps have a real case.
The crash-risk camp points out that affordability this stretched is historically fragile. If mortgage rates stay high while the economy weakens (rising unemployment, say), some owners could be forced to sell into a market with few buyers, which is exactly how a freeze can tip into falling prices. Pockets of the country that overbuilt or saw the biggest pandemic run-ups have already seen prices soften. Whether that broadens into a national decline is genuinely debated: some see limited downside, others real risk. No one can be sure.
The no-crash camp counters that the lock-in effect, ironically, is also a shock absorber: because so few owners are forced to list, there's no flood of supply to drive prices down, the opposite of 2008. Lending standards are far tighter than they were then, so fewer borrowers are overextended. In this view, a freeze that slowly thaws as rates ease is far more likely than a 2008-style collapse.
Ironically, the same lock-in effect that froze the market is also holding prices up. Whether it thaws gently or cracks depends mostly on rates and jobs, and no one can predict either. Educational context about how the mechanism works, not a forecast.
A 2008-style collapse doesn't come from high prices alone. It comes from distress: sellers who have to sell into a falling market.
The classic ingredients are (1) loose underwriting: many borrowers who couldn't really afford their loans; (2) negative equity: owing more than the home is worth, so selling means a loss; (3) rising delinquencies and foreclosures: owners falling behind; and (4) a demand shock like mass job losses. Stack those up and distressed homes flood the market, dragging prices down.
In mid-2026, those gauges were rising from very low levels but still far from 2008. Lending has been far tighter since 2008, so fewer borrowers are overextended, and years of price gains left most owners with substantial equity. But the distress isn't zero: Cotality's March 2026 loan-performance data showed overall mortgage delinquency around 3.0% (serious delinquency near 1.2%) and foreclosure inventory at a six-year high near 0.4%, while about 2.2% of mortgaged homes (roughly 1.2 million) were in negative equity as of Q4 2025 (Cotality). That is meaningful, and worse in weaker local markets, but not broad enough to resemble 2008's distress wave.
If you're tracking the risk, these are the gauges to watch (not a forecast): the mortgage delinquency rate, foreclosure starts, the share of homeowners with negative equity, the unemployment rate, and months of supply. A frozen market shows weak sales volume without distress; a crash needs the distress. If those gauges start climbing together, the freeze-versus-crash balance shifts, but nobody can reliably forecast if or when that happens.
You don't need to predict the market to read the headlines clearly. You need to know which gauge to check. When you next see "is the housing market crashing," ask two questions:
1. Are prices falling, or just sales? A drop in existing-home sales (volume) is a freeze; a drop in prices is a correction or crash. They're reported as different numbers, and headlines often blur them. Most of the 2020s story has been collapsing volume with roughly flat prices.
2. What are rates and inventory doing? Mortgage rates (which follow the 10-year Treasury) drive affordability and the lock-in effect; inventory shows whether the freeze is easing. Rising inventory + cooling rates is a thaw; falling prices + rising forced-sale listings would be the warning sign of something worse.
Both can be true at once: the market can be genuinely unaffordable and not crashing. That's what a freeze feels like.
Confused by rates, yields, housing, and the Fed? StockCram turns market jargon into plain English. Start with Foundations to see how interest rates ripple through the economy (sign in to save lessons and track your progress), then follow the Market Explainers series.
Common questions about whether the housing market is crashing, the lock-in effect, and affordability.
Not in the usual sense. A crash means home prices falling sharply alongside a wave of forced selling, like 2008. The mid-2020s market looks more like a freeze: existing-home sales dropped to multi-decade lows while national prices stayed roughly flat (about +1% a year). The main cause is the lock-in effect: owners with cheap ~3% pandemic mortgages won't sell into ~6.5% rates, so few homes get listed. It can feel like a crisis because it's so unaffordable, but unaffordable is not the same as crashing in price. No one can predict where prices go next.
For buyers, an affordability crisis is a fair description: affordability is near its worst in decades because high mortgage rates have pushed monthly payments far above incomes, even though prices mostly stopped rising. But a crisis of affordability is different from a crash in prices. In 2026 both can be true at once: housing is brutally hard to afford, yet prices aren't collapsing. Few listings and low sales volume show the supply side of that crisis; affordability is the demand side.
The lock-in effect is housing's "golden handcuffs." During the pandemic, mortgage rates fell near 3%, and tens of millions of owners locked in those ultra-cheap loans. To move now, they'd have to swap a 3% mortgage for one around 6.5%, often hundreds of dollars more a month for the same house, so most stay put. FHFA researchers estimated it prevented about 1.72 million home sales from mid-2022 to mid-2024, freezing inventory (and pushing prices up ~7% by choking supply). (It's unrelated to an IPO "lockup," which restricts insiders from selling shares.)
Mostly the lock-in effect. An owner with a 3% mortgage who sells and buys again at ~6.5% can see their monthly payment jump 40–50% for a comparable home, so unless a life event forces a move, the math discourages selling. With so many owners staying put, listings dry up and the market freezes. This is starting to ease in 2026 as more owners come to hold mortgages closer to today's rates, which shrinks the penalty for moving.
Because a freeze chokes off supply as much as demand. The lock-in effect keeps existing owners from listing, so not enough homes hit the market to force prices down, the opposite of 2008, when distressed inventory flooded in. Add tight lending and lots of homeowner equity (few owners underwater), and there's little forced selling. So prices can stay roughly flat even as sales volume collapses. Whether that holds depends on mortgage rates and jobs, which no one can reliably forecast.
It's the monthly payment, driven by rates, more than the sticker price. When a mortgage rate rises from 3% to 6.5%, the payment on the same home can climb 40–50%, so a given budget buys far less house, even if list prices barely moved. Add the big 2020–2022 price gains that never fully reversed, and the typical buyer is squeezed by the payment. Mortgage rates are high because they track the 10-year Treasury yield, which is elevated while the Fed keeps policy restrictive to fight inflation.
No one knows, and anyone claiming certainty is guessing. The honest, both-sides framing: the crash-risk camp notes that affordability this stretched is fragile, and forced selling in a weak economy could tip a freeze into falling prices. The no-crash camp notes that the lock-in effect keeps supply so thin that there's no flood of homes to drive prices down, the opposite of 2008, and lending is far tighter now. Published forecasts and commentary vary, and this article doesn't assign odds: the educational point is that crash risk depends less on headlines and more on distress gauges like unemployment, delinquencies, foreclosures, negative equity, and months of supply. This is educational context, not a forecast or advice.
Mortgage rates aren't set by the Fed directly: the 30-year fixed roughly tracks the 10-year Treasury yield. So they'd ease mainly if long-term yields fall, which tends to happen when inflation cools and markets expect the Fed to loosen. As of mid-2026, with inflation cooling to 3.5% (June CPI) but the Fed still restrictive, yields and mortgage rates stayed elevated (mortgages in the mid-6% range). Whether and when they fall depends on inflation and Fed policy, which no one can predict.
That depends on your personal budget, job stability, local market, and how long you plan to stay, so this article can't tell you whether to buy or wait. The useful, non-advice takeaway is that affordability depends more on the monthly payment than on the headline price: a buyer's real question is what the payment looks like at today's mortgage rate, not just whether a national crash is coming. Watching mortgage rates, local inventory, and local price trends tends to matter more than the national headline.
What changed on this page since it was published, newest first.
Update (September 25, 2026): Mortgage rates kept climbing: Freddie Mac reported the 30-year at 7.03% for the week ending September 24, up from 6.95% the prior week, with many lenders now above 7%. The 10-year Treasury yield surged to around 5.20% by late September, the highest since mid-2007, driven by inflation concerns and strong economic data. August data (3.98 million annualized, 1.62 million units inventory, 4.9 months' supply) remains the latest; September figures arrive October 13. Rates kept rising after the Fed's September 16 hike, and the freeze pattern persists.
Update (September 18, 2026): Mortgage rates jumped sharply after the Fed hiked rates September 16: Freddie Mac reported the 30-year at 6.95% for the week ending September 17, up from 6.76% the prior week, with some lenders crossing 7%. The Fed raised its benchmark by 25 basis points to 3.75%-4.00%, unanimously, the first hike since 2023. The 10-year Treasury yield spiked to around 5% following the decision, the highest since July 2007. The August existing-home sales data (3.98 million annualized, inventory at 1.62 million units, 4.9 months' supply) remains the latest. Rates climbed, the freeze pattern persists.
Update (September 11, 2026): Mortgage rates continued climbing: Freddie Mac reported the 30-year at 7.03% for the week ending September 24, up from 6.95% the prior week, with many lenders now above 7%. The 10-year Treasury yield surged to around 5.20% by September 25, the highest since mid-2007, driven by inflation concerns and strong economic data. Sales in August (released September 10) fell 2.0% to 3.98 million annualized, inventory rose 3.2% to 1.62 million units (4.9 months' supply, the highest in over a decade), and the median price rose 1.6% year-over-year to $429,100. The Fed raised rates 25 basis points to 3.75%-4.00% on September 16, unanimously, the first hike since 2023. Sales stayed weak, inventory rose gradually, and prices inched up.
Update (September 4, 2026): Mortgage rates climbed further: Freddie Mac reported the 30-year at 6.71% for the week ending September 3, up from 6.66% the prior week, marking a 13-month high. The 10-year Treasury yield traded around 4.76% to 4.79% as of early September, up from 4.68% in late August. August existing-home sales (released September 10) fell 2.0% to 3.98 million annualized, inventory rose to 1.62 million units (4.9 months' supply, the highest in over a decade), and the median price rose 1.6% year-over-year to $429,100. The Fed raised rates September 16, as expected. Sales volume stayed weak, inventory rose gradually, and prices inched up.
Update (August 28, 2026): Mortgage rates ticked up: Freddie Mac reported the 30-year at 6.95% for the week ending September 17, up from 6.76% on September 10, with some lenders crossing 7%. The 10-year Treasury yield spiked to around 5% by mid-September, the highest since July 2007. August existing-home sales (released September 10) fell 2.0% to 3.98 million annualized, inventory rose to 1.62 million units (4.9 months' supply, the highest in over a decade), and the median price rose 1.6% year-over-year to $429,100. Volume stayed weak, inventory remained thin, and prices inched up.
Update (August 21, 2026): Mortgage rates eased further: Freddie Mac reported the 30-year at 6.65% for the week ending August 20, down from 6.67% the prior week and 6.69% on August 6. The 10-year Treasury yield traded around 4.64% after hitting a 20-month high of 4.75% earlier in the week. Volume stayed weak (July existing-home sales at 4.06 million annualized, down 1.7%), inventory at 1.54 million units (4.6 months' supply), and the median price up 2.0% year-over-year to $431,400.
Update (August 14, 2026): The July existing-home sales report arrived August 11: sales fell 1.7% to 4.06 million annualized, inventory slipped to 1.54 million units (4.6 months' supply), and the median price rose 2.0% year-over-year to $431,400. Freddie Mac's 30-year mortgage rate eased to 6.65% for the week ending August 20, down from 6.67% on August 13 and 6.69% on August 6. The 10-year Treasury yield traded around 4.64% after hitting a 20-month high of 4.75% earlier in the week. Volume stayed weak while prices inched up.
Update (August 8, 2026): The Fed held rates at 3.50%-3.75% on July 29 (with three dissents), and mortgage rates have since climbed to near one-year highs. Freddie Mac reported the 30-year rate at 6.69% for the week ending August 6, 2026, up from the mid-6.5% range in mid-July, but it eased to 6.67% by the week ending August 13. The 10-year Treasury yield held around 4.65% through mid-August. The July existing-home sales report (released August 11) showed sales fell 1.7% to 4.06 million annualized, inventory at 1.54 million units, and the median price up 2.0% year-over-year to $431,400. Affordability remained strained.
Market figures referenced are approximate, as of late July 2026, and used for educational illustration. Figures change continuously. Last reviewed: October 9, 2026.
Educational content only. StockCram is not a broker-dealer, investment adviser, real-estate brokerage, or financial institution, and nothing here is investment, buying, or selling advice. Historical data is shown for context; past performance does not indicate future results.
"Is the housing market crashing?" is the wrong question for the mid-2020s. The market isn't crashing in price. It's frozen in volume, held shut by the lock-in effect (cheap old mortgages vs expensive new ones) and a brutal affordability squeeze, both downstream of high interest rates. As of mid-2026, some gauges showed partial-thaw signs, higher inventory and some easing in the lock-in, while affordability stayed strained and the pattern could change.
A better headline filter: when you hear "housing crash," check four gauges: prices, sales volume, inventory, and distress (delinquencies and foreclosures). A freeze shows weak volume *without* distress; a crash needs the distress. Knowing which one you're looking at is the difference between panic and understanding.
Go deeper on the rate story behind it all: why stocks rise when rates are high, the Fed's June 2026 decision, or how rates ripple through the economy.
Frozen is not the same as crashing
A crash is a price event (sharp declines + forced selling, like 2008); a freeze is a volume event (sales dry up, prices roughly flat). The mid-2020s market is a freeze.
The lock-in effect froze it
Owners with ~3% pandemic mortgages won't trade them for ~6.5% rates, often hundreds more a month for the same house, so few list. FHFA estimated the lock-in prevented ~1.72M home sales from 2022–2024 (and pushed prices up ~7% by choking supply).
Housing is downstream of interest rates
Mortgage rates track the 10-year Treasury, which is elevated while the Fed fights inflation, so mortgages stay high even when the Fed pauses, and the freeze persists.
It's an affordability crisis, not (yet) a price crash
Higher rates pushed monthly payments 40–50% above pandemic levels, so housing is brutally unaffordable even with flat prices. Crisis of affordability ≠ crash in price.
Some mid-2026 data showed partial-thaw signs
6%+ mortgages came to outnumber sub-3%, active listings reached ~1.1M (highest since 2019, per Realtor.com), and price growth cooled to ~1%. But spring underwhelmed: partial improvement, not full normalization.
You've heard "high rates are bad for stocks," yet stocks are near record highs. Here's the plain-English why, both sides, anchored to the 2026 market.
At Kevin Warsh's first meeting, the Fed held rates in June 2026, but flipped its signal toward a hike. A plain-English decode of what happened and why it matters.
Is the U.S. dollar being devalued or just weakening? Learn the real difference between devaluation and depreciation, why markets care, and how it affects inflation, Treasury yields, mortgage rates, and your investments.