
Thursday, October 15
Stock Market Today
StockCram Markets explains what moved stocks today, the economic events that matter this week, and why investors are reacting, in plain English and updated through the trading day.
Previous session close · Oct 14, 4:00 PM ET
Market in 30 Seconds
Stocks were flat Tuesday as Fed's Williams signaled one more hike this year, pulling the 10-year yield to 5.22% before today's CPI inflation report.
Key drivers · from Oct 14 briefing
- Fed's Williams Says One More Rate Hike This Year, None Needed in 2027Investors read this as a sign that the Fed's rate-hiking cycle may end soon.
- September Inflation Report Lands Today With Prices Expected to Heat UpThis is the last inflation reading before the Fed's October 28 meeting.
- Big Banks Report Mixed Third-Quarter Results as Earnings Season StartsStrong profits are holding up the market.
Latest Market Updates
Market news as it breaks, newest first.
- 5h agoCNBC
ASML beat earnings. EPS $14.50 beat $12.17 and raised outlook on AI demand. Bottom line: chip equipment demand remains strong. $ASML
How the Last Session Played Out
Wednesday, Oct 14: where the indexes ended and how our read of the day changed. Not live.
- S&P 500-1.11%
- Nasdaq-100-1.97%
- Dow Jones-0.16%
- 10:30 AMFirst read
The market opened mixed, with the S&P 500 and Nasdaq-100 lower while the Dow is holding up better. The main pressure is in chip stocks, where memory makers are sliding on worries about Chinese competition, and that matters because the Nasdaq is heavily weighted toward technology. Bank earnings are also in focus, but early reactions have been split.
- 2:30 PMLast read
Stocks are broadly lower at the open, with all three major indexes pointing the same way, even as headlines describe the market as flat and futures nudging higher. The mixed signals reflect traders weighing a recent CPI reading, which came in cooler than expected on the core measure, against oil above $100, which keeps inflation worries front of mind.
A record of one past session; what happened then does not show what happens next.
What's Moving
The largest moves among the stocks and funds StockCram covers, each with its explanation.
- Robinhood Markets HOODWhy is Robinhood Markets stock down today?$101.09-8.53%
- Strategy MSTRWhy is Strategy stock down today?$143.24-5.87%
- Advanced Micro Devices AMDWhy is Advanced Micro Devices stock down today?$570.87-5.72%
- Coinbase Global COINWhy is Coinbase Global stock down today?$172.88-4.90%
- Palantir Technologies PLTRWhy is Palantir Technologies stock down today?$201.04-3.66%
- Meta Platforms METAWhy is Meta Platforms stock down today?$738.24-3.18%



Previous session close · Oct 14, 4:00 PM ET
Understand Today's Market
The concepts behind today's biggest market stories.
Past Days Like Today
Earlier briefings that covered the same mix of stories. Matched by topic, not by price; what happened then does not show what happens next.
Economic Calendar
The scheduled releases that tend to move markets this week.
This Week
No major events
No major events
- Inflation8:30 AM Consumer Price Index (CPI)
- Inflation8:30 AM Producer Price Index (PPI)
- Jobs8:30 AM Weekly Jobless Claims
- Event8:30 AM Retail Sales
- Event9:15 AM Industrial Production
Economic data via FRED® · Data sources
Keep Reading
The full daily briefing, the weekly recap, and our latest explainers.
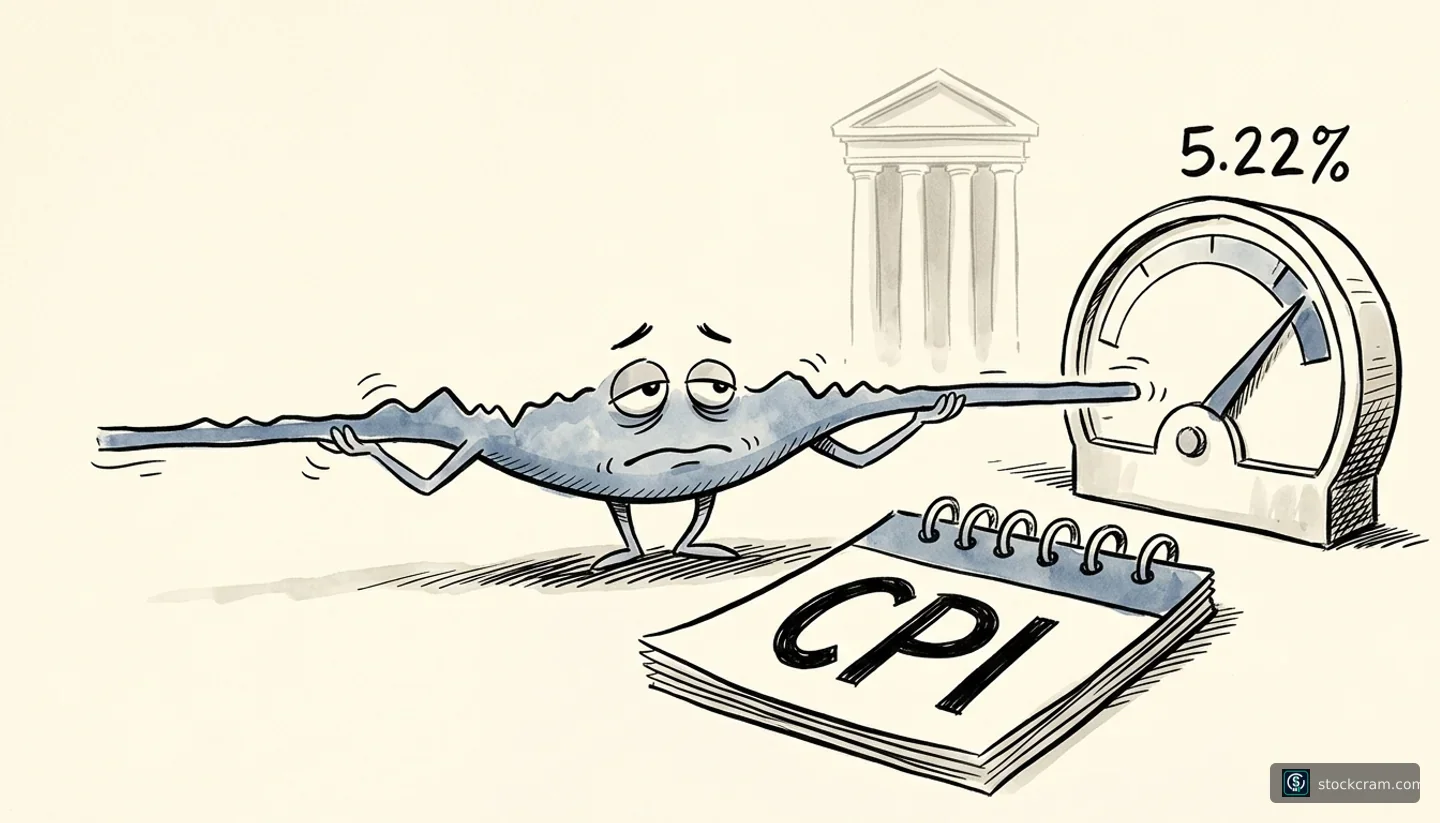
Stock Market Today, Oct 14: CPI Report Due
- The S&P 500 closed at 7,805.45 on Tuesday, down 0.02%, while the Dow slipped 0.35% to 51,670.10 and the Nasdaq fell 0.15% to 27,204.38.
- Fed's Williams backed one more hike in 2026 but none in 2027, which pushed the 10-year yield down to about 5.22%.
- Today's September CPI is forecast at 3.6% a year versus 3.4% in August, and the Fed meets October 28.
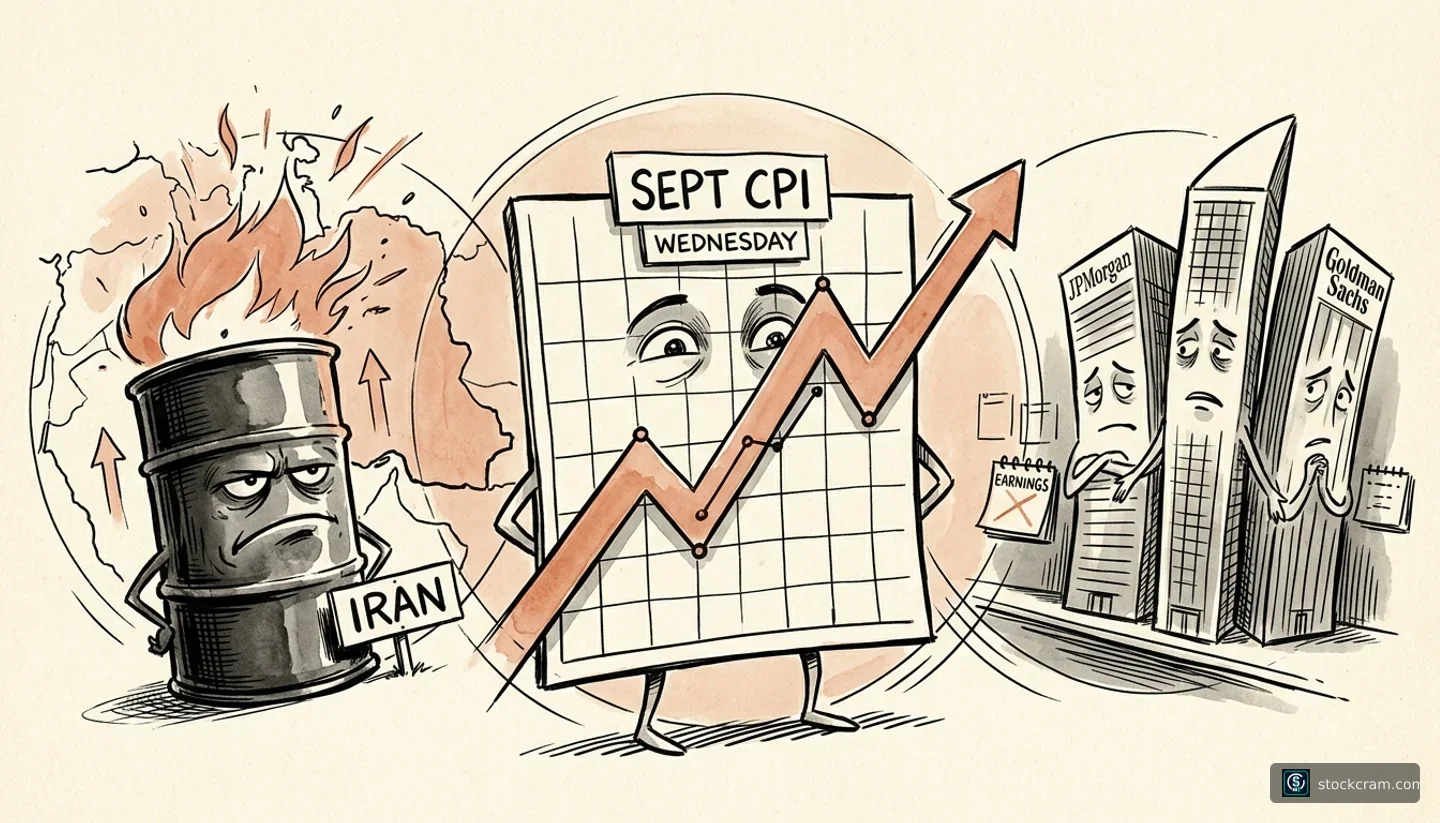
CPI, Iran Oil Shock, and Bank Earnings
- Consumer Price Index (CPI) – September
- Producer Price Index (PPI) – September
- Retail Sales – September
- Federal Reserve Beige Book
From the Blog
See all posts →
ai-tech-stocks
iPhone Duo: Apple Stock After 8 Major Launches
Apple has unveiled the iPhone Duo, its first foldable iPhone, from $1,999. We analyzed what Apple stock actually did after eight major Apple launches, each compared with the S&P 500.

ai-tech-stocks
Anthropic IPO: Date, Ticker, Price, Lockup & How to Buy
Anthropic has submitted a confidential draft to the SEC but is still private. No ticker, no date, no IPO price yet - here's what is actually confirmed, and what it means for retail buyers.
economy-interest-rates
Why the Fed Might Raise Rates in September 2026 After Markets Expected Cuts
The Federal Reserve's September 2026 meeting has markets on edge. Despite year-over-year inflation appearing stable, Fed Chairman Kevin Warsh's Jackson Hole speech shifted rate hike odds to nearly 50-50. The disconnect isn't about what the data shows, it's about which data the Fed prioritizes and how recent monthly trends can tell a completely different story than the annual numbers making headlines.
Frequently Asked Questions
Markets move on the balance of the day’s news — economic data (inflation, jobs, growth), Federal Reserve signals, corporate earnings, commodity prices like oil, and global events. The Market in 30 Seconds and Market Pulse sections summarize the day’s drivers in plain English. This is educational context, not a prediction.
Market sentiment is a read on the overall mood of the market — whether news flow is leaning bullish (optimistic) or bearish (cautious). StockCram’s market mood blends four signals: an investor fear-and-greed reading, the S&P 500’s trend, the tone of the day’s news, and volatility. The hub shows which way each one points and how much it counts. It is not a forecast or a trading signal.
The Economic Calendar shows the scheduled releases that tend to move markets — the Fed’s rate decisions (FOMC), inflation (CPI, PPI, PCE), the monthly jobs report, and GDP — with their dates and times. Release dates come from the Federal Reserve’s FRED data; market holidays and early closes are computed from the official NYSE schedule.
No. StockCram is an educational platform — not a broker-dealer, investment adviser, or financial institution. Everything here is for learning how markets work. It is not investment advice, and nothing on this page is a recommendation to buy or sell any security.
Throughout the trading day. Index levels and the day’s movers refresh through the session, the daily briefing is published before the open, the live Market Pulse updates as news breaks, and a weekly recap and the week-ahead calendar refresh over the weekend.
Educational purposes only. This content does not constitute investment advice. Read our disclaimer
StockCram is not a broker-dealer, investment adviser, or financial institution. All content is for educational and informational purposes only and should not be construed as personalized investment advice. Consult a qualified financial professional before making investment decisions. Past performance does not guarantee future results.