
Dot-Com Bubble Burst: How Long Did It Take to Recover?
The Nasdaq fell 78% after March 2000 and took 15 years to regain its high. The S&P 500 fell 49%, was back by 2007, and has stayed above its 2000 record since 2013.
15 min read
Read Article
The Dow fell 48.5% from its January 1906 high to its November 1907 low, mostly before the October bank runs. Recovery came in 1908 counting dividends, and in 1915 by Dow price.

Educational purposes only. This content does not constitute investment advice. Read our disclaimer
StockCram is not a broker-dealer, investment adviser, or financial institution. All content is for educational and informational purposes only and should not be construed as personalized investment advice. Consult a qualified financial professional before making investment decisions. Past performance does not guarantee future results.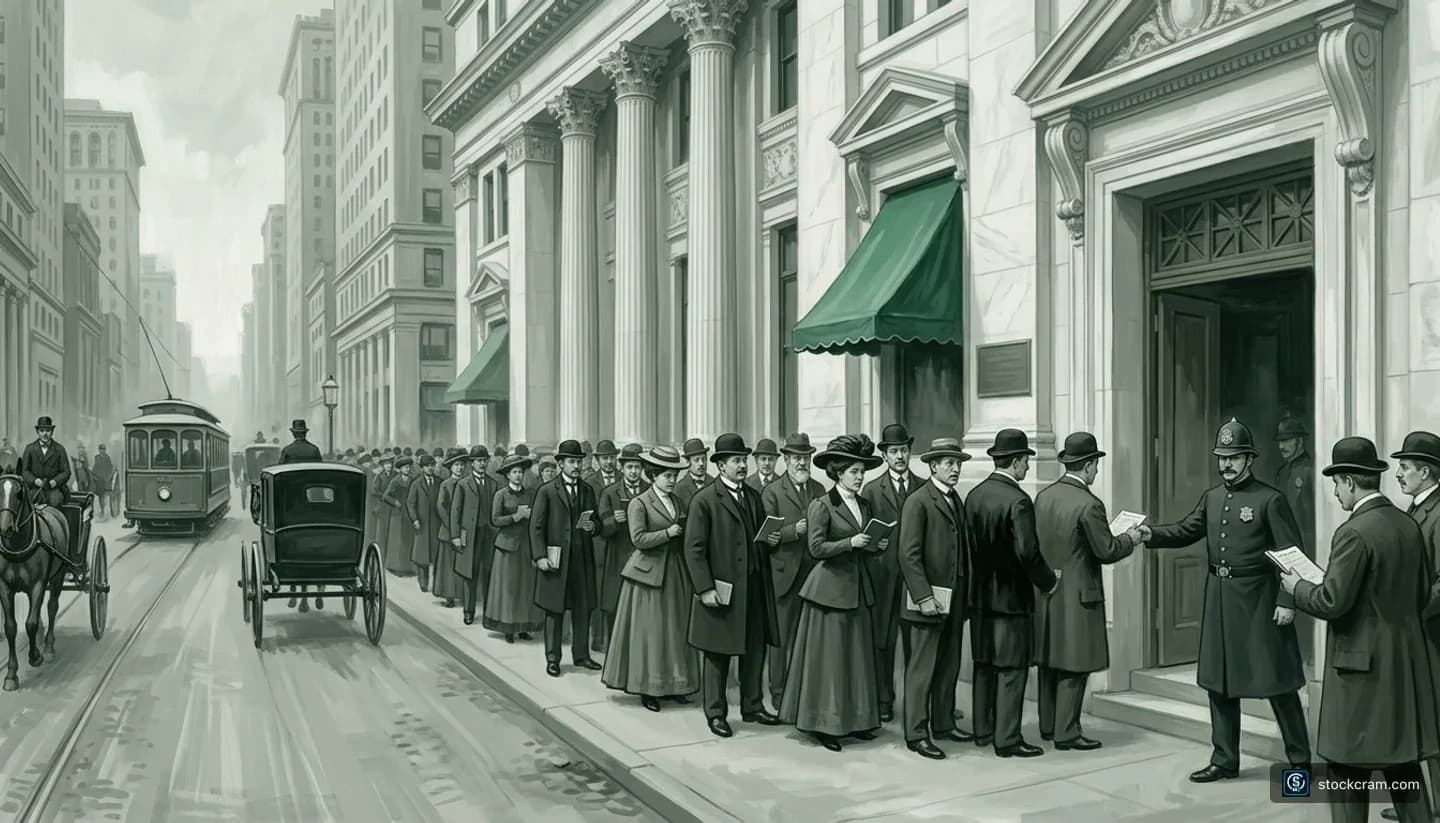
In the Panic of 1907, the Dow Jones Industrial Average fell 48.5%, from a record close of 103.00 points on January 19, 1906 to 53.00 on November 15, 1907. Most of that drop came before the panic itself, the October 1907 bank runs in New York. On September 30, 1907, before the first run, the Dow was already 34% below its record.
The runs began after a failed attempt to corner a copper stock: depositors pulled money first from banks tied to the two speculators behind it, then from New York's trust companies, which kept little cash on hand. J.P. Morgan led a private rescue that helped keep the stock exchange open, and the panic pushed Congress toward creating the Federal Reserve. The recovery date depends on the yardstick, and the two answers below use two different indexes. Counting dividends, a broad reconstructed index of the market was back above its 1906 peak by December 1908. The Dow's price took much longer: the original 12-stock average passed its old high in 1915. Some Dow tables say 1916, because the index was rebuilt that year.
Free · pretend money
Panic of 1907 simulator: what would you have done?
12 moments, real Dow closes, about 7 minutes. You only see the news of each day.
Historical simulation with pretend money. Past performance does not indicate future results. Not investment advice.
Our Panic of 1907 replay is a free game: you start in 1905 with $10,000 in pretend money, read the news as it happened, and choose how much to keep in stocks. The daily closes show something easy to miss: the Dow's worst day came months before the famous bank runs. On Tuesday, October 22, 1907, the day Knickerbocker Trust shut its doors, the Dow fell 2.8%. The worst day of the whole fall was Thursday, March 14, 1907, seven months earlier, when it dropped 8.3% and no bank failed.
Five numbers sum up the Panic of 1907 for investors; each is explained in the sections below.
In the Panic of 1907 the Dow fell 48.5% from its record close to its low, over 22 months. At the time, the Dow was an average of the prices of 12 large industrial stocks, and its level is counted in points, not dollars: a fall from 103 points to 53 means those stocks' average price roughly halved. In money terms, $1,000 that followed the Dow from the January 1906 record was worth $515 at the November 1907 low, not counting dividends.
Measured over calendar 1907 alone, the fall is smaller, because the Dow ended 1906 already 8% below its January record. From 94.35 on December 31, 1906 it fell 43.8% to the low, and it ended 1907 at 58.75, down 37.7% for the year. Robert Shiller's reconstructed broad-market series, the S&P composite, fell 37.7% on monthly averages from its September 1906 peak to November 1907, the same figure by coincidence. The table shows the main days for the Dow. All Dow figures on this page are price only, from the daily closes of the 12-stock average as printed at the time; the dividend figures come from Shiller's series, a reconstruction rather than a fund anyone could buy in 1907.
Closes from MeasuringWorth's daily Dow series, restored to the levels printed at the time. The exchange also held Saturday sessions, so a Monday's change is measured from Saturday's close. "$1,000 became" follows $1,000 from the January 19, 1906 close, price only. Historical data shown; past performance does not indicate future results.
| Date | Dow close | Change that day | Below the record | $1,000 became |
|---|---|---|---|---|
| Fri, Jan 19, 1906 (record) | 103.00 | +0.7% | 0% | $1,000 |
| Wed, Apr 18, 1906 (San Francisco earthquake) | 95.67 | -1.2% | -7.1% | $929 |
| Thu, Mar 14, 1907 (worst day) | 76.23 | -8.3% | -26.0% | $740 |
| Mon, Sep 30, 1907 (before the runs) | 67.72 | +0.8% | -34.3% | $657 |
| Wed, Oct 16, 1907 (United Copper corner fails) | 60.46 | -2.6% | -41.3% | $587 |
| Tue, Oct 22, 1907 (Knickerbocker Trust suspends) | 59.11 | -2.8% | -42.6% | $574 |
| Thu, Oct 24, 1907 (call money hits 100%) | 58.18 | -0.1% | -43.5% | $565 |
| Fri, Nov 15, 1907 (the low) | 53.00 | -2.5% | -48.5% | $515 |
| Thu, Dec 31, 1908 | 86.15 | +0.3% | -16.4% | $836 |
| Fri, Nov 19, 1909 (closest to the record) | 100.53 | +0.2% | -2.4% | $976 |
The trigger for the Panic of 1907 was a failed attempt to corner United Copper stock. The deeper problem was a banking system in which New York's trust companies held little cash and had no central bank behind them, so when runs reached them they could not pay their depositors. It hit a market already weakened by more than a year of tight money after the 1906 San Francisco earthquake, and an economy in recession since May 1907.
On October 16, 1907, two speculators, F. Augustus Heinze and Charles W. Morse, lost heavily trying to corner the stock of United Copper. Cornering means buying up so much of a stock that traders who have bet on its fall, by selling shares they borrowed, are forced to buy back from you at your price. When the corner failed, depositors pulled money from banks tied to the two men. The New York Clearing House, a private association of the city's big banks, examined those banks, declared them solvent (able to pay what they owed) and lent to them, and those runs eased.
The runs moved to the trust companies. On Friday, October 18, news broke that Charles T. Barney, president of the Knickerbocker Trust, was an associate of Morse. Depositors lined up. Trust companies took deposits like banks but were less regulated, and they kept about 5% of deposits as cash, against 25% at national banks, the federally chartered banks of the day. Most trusts were not Clearing House members, so on Monday, October 21, the Clearing House turned down Knickerbocker's request for help. Benjamin Strong, a banker leading a team J.P. Morgan put together to examine its books, could not tell in the time he had whether it was sound, and Morgan declined to lend. On October 22, after depositors had withdrawn nearly $8 million, Knickerbocker suspended payments. It reopened in March 1908, after $2.4 million of new capital was put in, according to Federal Reserve History.
That turned a run into a panic. People tried to hold cash instead of deposits wherever they could. Deposits at New York's trust companies fell by more than 36% between August 22 and December 19, 1907, while deposits at national banks rose. The trusts had also been lending to stockbrokers, so the runs drained cash from the stock market at the same moment. That is what a liquidity crunch looks like: people want cash, and stocks are one of the few things they can sell quickly. Federal Reserve History cites two studies, one by Carola Frydman, Eric Hilt and Lily Zhou and one by Caroline Fohlin, Thomas Gehrig and Marlene Haas, that point to rumor. In their view it played a large part in spreading the runs, because depositors could not easily tell which trusts were sound.
J.P. Morgan led the private rescue in the Panic of 1907. Having refused Knickerbocker, he raised cash from banks and companies and lent to trust companies his team judged sound, and Federal Reserve History says the stock exchange stayed open "largely because of" his actions.
There was no central bank to lend in an emergency. Stockbrokers borrowed every day to carry stocks their customers had bought with borrowed money, on margin, through overnight loans called call money. When Knickerbocker closed, the call money rate jumped from 9.5% to 70% a year, and two days later, on Thursday, October 24, it reached 100%. At 100% a year, borrowing $1,000 for one night cost about $2.74, against about 26 cents at 9.5%, and at times nobody would lend even at 100%. Shortly before the close that day, the New-York Tribune reported the next morning, "J. P. Morgan & Co. lent $25,000,000 on the Stock Exchange floor." The Treasury Secretary, George Cortelyou, also deposited government money in New York banks.
On Saturday, October 26, the Clearing House moved to issue loan certificates, IOUs its banks could use to settle with each other instead of cash, and its member banks limited how much cash depositors could take out. A dollar in cash became worth more than a dollar in a bank account, so it paid to ship gold to New York and turn it into cash. Those gold imports, in Federal Reserve History's words, "appear to have been instrumental" in the recovery of New York's markets. In early November, U.S. Steel's Elbert Gary and Henry Clay Frick asked President Theodore Roosevelt whether he would object to their buying the Tennessee Coal, Iron and Railroad Company; he wrote that he felt it "no public duty of mine to interpose any objections." The deal was meant to save Moore & Schley, a brokerage firm that Roosevelt was told would "undoubtedly fail this week if help is not given." Its assets included "a majority of the securities" of the company, shares that New York banks held as collateral for its loans.
On Monday, November 4, the Dow rose 1.9%. It still fell another 9% over the next 11 days, to its low on November 15. The rescue kept the exchange trading. It did not set a bottom for prices: the Dow kept falling until November 15, 1907.
The recovery from the Panic of 1907 depends on the index. Using a broad-market index with dividends reinvested, recovery took 27 months from peak to peak. Using the original 12-stock Dow by price alone, it took 9 years and 8 months. With dividends reinvested, the broad market peaked in September 1906, bottomed 14 months later and was back in December 1908, 13 months after the low. By price, the Dow peaked in January 1906, got within 2.4% of its record in November 1909, fell back, and was above it by September 1915 on NBER's monthly figures, almost 8 years after the November 1907 low.
A drawdown of 48.5% needs a rise of 94% to get back to even, because the climb starts from the lower level. In the two years after its low, the Dow rose 90%: on November 19, 1909 it closed at 100.53, 2.4% below its record. Then it fell back. On July 31, 1914, at the start of the First World War, the New York Stock Exchange shut; the Dow's last close, on July 30, was 71.42. When trading resumed on December 12, 1914, the same 12-stock average picked up again and climbed in the wartime boom. NBER's monthly figure for September 1915, the midpoint of that month's highest and lowest close, is 107.10, so the Dow was back above its 1906 record by then.
Some Dow histories say 1916 instead, because the index changed. In October 1916 Dow Jones launched a 20-stock average and traced it back to December 12, 1914, where it starts at 54.62, much lower than the 12-stock average. Most modern Dow tables use that newer series, and in it the first close above 103 is September 28, 1916. Comparing 103 from the old index with the new one mixes two different sets of stocks on two different scales. MeasuringWorth's long-run series joins the two at one constant ratio and puts the first close above the 1906 level on July 28, 1915, about two months before NBER's September figure. Either way it is 1915, and we use the September 1915 monthly figure, about 9 years and 8 months after the peak.
Dividends, the cash companies paid out to shareholders, change the answer. Yale economist Robert Shiller's monthly data cover the S&P composite, a reconstructed series of many more stocks than the Dow, which peaked in September 1906. That index, with dividends reinvested, was back above its peak in December 1908 and stayed above it from March 1909. Counting price alone, it got back in August 1909, stayed until January 1910 and then fell below again. Those are monthly averages, and no index fund existed in 1907, so they describe the market, not any one investor's account.
The economy recovered on a similar clock. The recession lasted from May 1907 to June 1908. Industrial output fell 17% in 1908, according to Federal Reserve History, which notes that unlike the Great Depression, "the real sector recovered rapidly, in little over a year."
After the 1929 crash, when the Dow fell 89%, getting back to the old record by price took 25 years. After the dot-com bubble burst in 2000, the Nasdaq took 15 years. After Black Monday 1987, the S&P 500 was back above its pre-crash record by price in July 1989.
You can replay the Panic of 1907 in our market-history game and decide how much to keep in stocks or cash as the news unfolds.
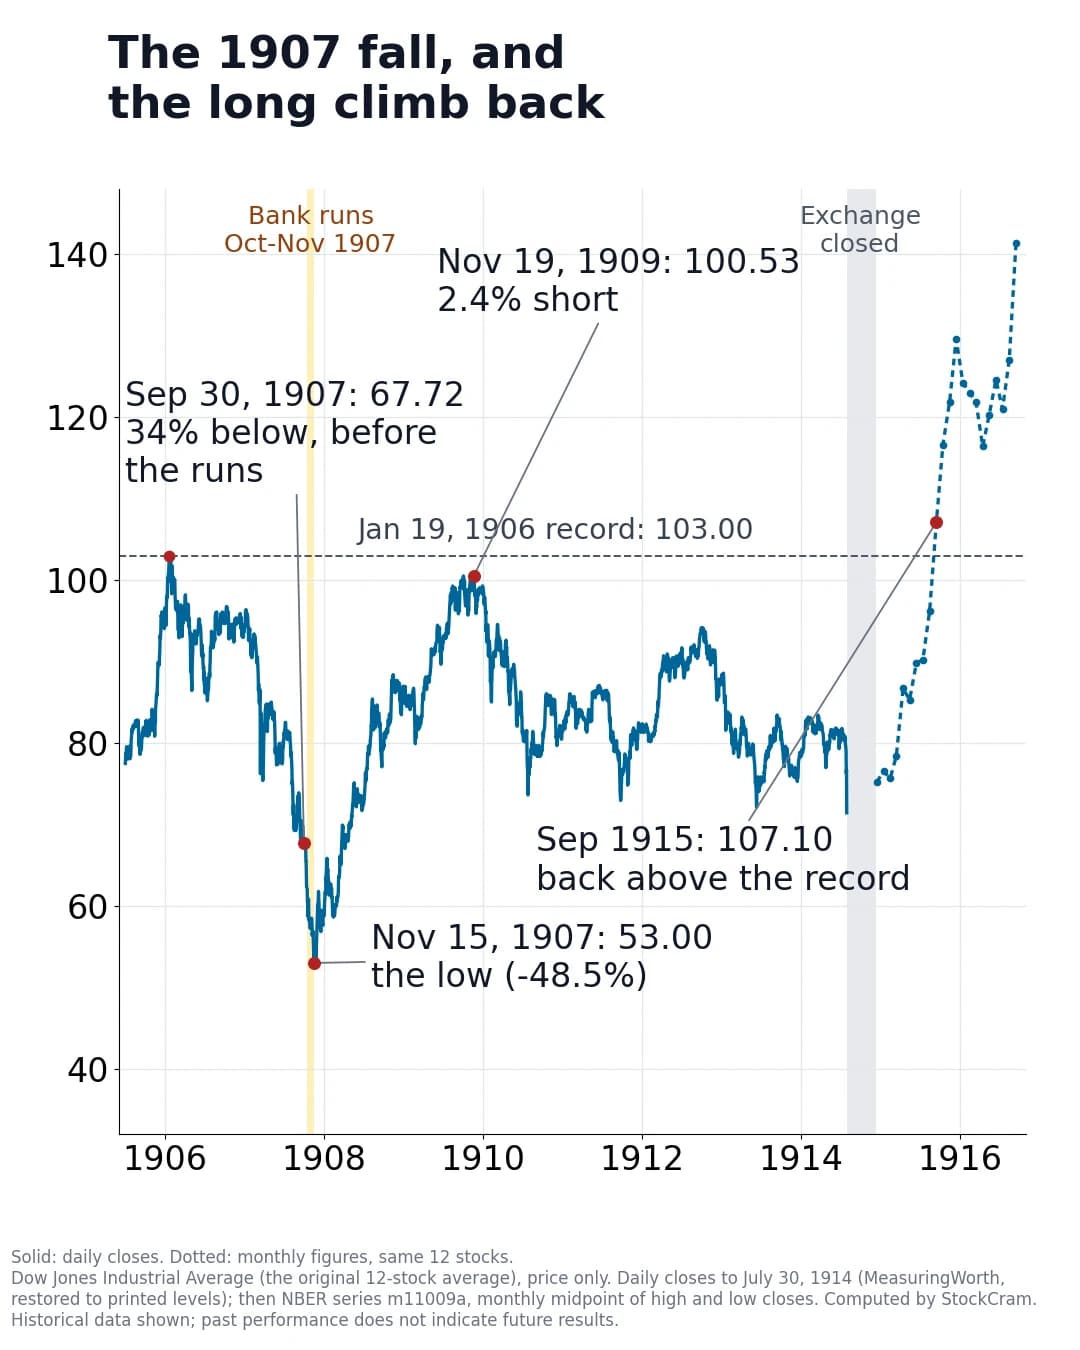
Daily Dow closes from MeasuringWorth (price only) to July 1914; the September 1915 figure is NBER's monthly series for the same 12-stock average. S&P composite figures use Robert Shiller's monthly averages of the index and its dividends, accurate to the month. Historical data shown; past performance does not indicate future results.
| Measure | Peak | Low | Back to the peak | Peak to recovery |
|---|---|---|---|---|
| Dow, price only (daily) | 103.00, Jan 19, 1906 | 53.00, Nov 15, 1907 (-48.5%) | By Sep 1915 (NBER monthly figure 107.10). Closest before the 1914 closing: 100.53 on Nov 19, 1909 | 9 years 8 months (almost 8 years from the low) |
| S&P composite, price only (monthly) | Sep 1906 | Nov 1907 (-37.7%) | Aug 1909, fell below again after Jan 1910 | 2 years 11 months, not held |
| S&P composite, dividends reinvested (monthly) | Sep 1906 | Nov 1907 | Dec 1908; for good from Mar 1909 | 2 years 3 months (13 months from the low) |
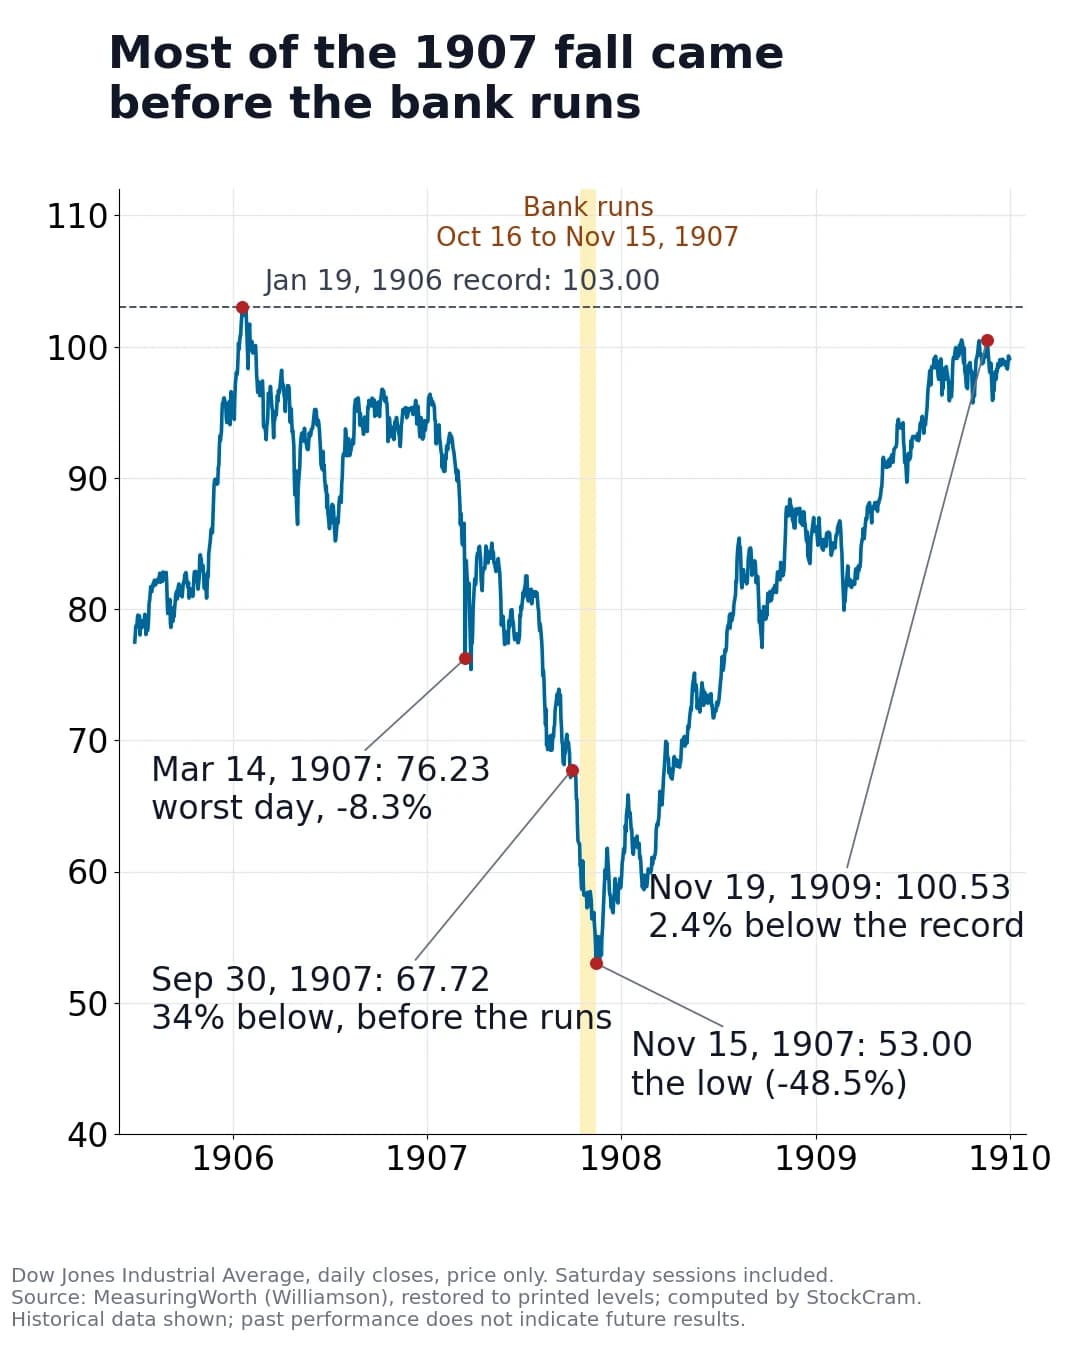
About 70% of the Dow's 1906 to 1907 fall came before the October panic: 35 of the 50 points it lost were gone by September 30, 1907. The runs in October and November took it down the last 15 points, from 67.72 to 53.00.
The slide had begun more than a year earlier. The New York Fed's history of the panic traces part of it to the San Francisco earthquake of April 18, 1906. British insurers paid huge claims, gold flowed from London to the United States, and the Bank of England raised its lending rate to stop the outflow. Money got tighter on both sides of the Atlantic. The same history calls what followed a "silent crash", and the US economy slipped into recession in May 1907.
The sharpest selling came in March 1907, when railroad stocks such as Union Pacific and Reading led a two-day fall, the New-York Tribune reported, though no firm failed. On Thursday, March 14, the Dow lost 8.3%, the Dow's worst day of the whole decline, then rose 6.7% the next day. On August 3, Judge Kenesaw Mountain Landis fined Standard Oil of Indiana $29.24 million for taking illegal railroad rebates; an appeals court threw out the conviction in July 1908. From August 2 to August 16 the Dow fell 12%, from 78.87 to 69.29.
Before October this was a bear market, a long, uneven slide with sharp rallies mixed in, and no depositors lining up outside banks. The bank panic came later, and it landed on a market that was already weak.
Both figures for the 1907 stock market drop are right. They start from different dates, and one uses monthly averages instead of daily closes.
40.9% comes from economists Frederic Mishkin and Eugene White, in a 2002 working paper for the National Bureau of Economic Research (NBER): "Hitting bottom in November 1907, the Dow Jones fell 40.9 percent." They measure from December 1906, not the January 1906 record, and they use NBER's monthly Dow series, where each month is the average of that month's highest and lowest close. December 1906 averaged 94.40 and November 1907 averaged 55.75. The fall between those two averages is 40.9%.
Almost 50%, the often-quoted figure, matches the close-to-close fall from the record: 103.00 on January 19, 1906 to 53.00 on November 15, 1907, or 48.5%.
We checked NBER's monthly figures against the daily closes before using either, and they agree month by month.
The Panic of 1907 convinced Congress that the banking system needed a lasting fix, and six years later it created the Federal Reserve.
In 1908, Congress passed the Aldrich-Vreeland Act. It let groups of national banks obtain emergency currency in a future crisis and set up the National Monetary Commission, chaired by Senator Nelson Aldrich, to study the banking system. The commission's work led, after years of argument about how much control bankers should have, to the Federal Reserve Act, signed by President Woodrow Wilson on December 23, 1913. Federal Reserve History describes the Clearing House loan certificates of 1907 as the forerunner of the Fed's discount window, the emergency lending it still offers banks.
The Fed's historians also point to how much 1907 looks like 2008. Both crises began at New York firms that borrowed and lent like banks without being regular banks: trust companies then, investment banks and other "shadow banks" in 2008. Knickerbocker's suspension and Lehman Brothers' failure each marked the start of the worst of the crisis. In 1907 there was no central bank to lend in a panic and no FDIC deposit insurance; both exist now. For how the Fed works today, see what the Federal Reserve is.
Market figures below use the same datasets described in Sources and Method.
The panic itself ran from mid-October into November 1907: the United Copper corner failed on October 16, Knickerbocker Trust suspended on October 22, and stocks hit their low on November 15. The stock market had been falling since its January 1906 record.
Yes, though it was slow. Economists Frederic Mishkin and Eugene White call it "the 1907 crash": the Dow fell 48.5% from January 1906 to November 15, 1907, with its worst single day, down 8.3%, on March 14, 1907, months before the October bank runs.
The Dow fell 48.5%, from 103.00 on January 19, 1906 to 53.00 on November 15, 1907. Over calendar 1907 it fell 37.7%. The often-quoted 40.9% uses monthly averages from December 1906.
It depends on the measure. With dividends reinvested, the broad S&P composite took 27 months from its September 1906 peak to get back there, in December 1908, 13 months after the November 1907 low. Measured by price, the Dow needed 9 years and 8 months from its January 1906 record: it came within 2.4% in November 1909, fell back, and passed the record by September 1915. The economy recovered in a little over a year.
The acute banking panic lasted roughly three weeks, from mid-October into early November 1907; withdrawals from the Trust Company of America went on for about two weeks after Knickerbocker closed on October 22. The stock market kept falling afterward and reached its low on November 15. Its whole fall lasted 22 months, from January 1906, and the recession 13 months, from May 1907 to June 1908.
Because the Dow changed. The original 12-stock average was back above its 1906 high by September 1915. In October 1916 Dow Jones switched to a 20-stock average and traced it back to December 1914 at a lower level; many modern Dow tables use that series, where the first close above 103 is September 28, 1916.
A failed attempt to corner United Copper stock set off runs on New York banks and then on trust companies, which held little cash. Knickerbocker Trust's suspension on October 22 turned the runs into a panic. Tight money after the 1906 San Francisco earthquake and a recession that began in May 1907 had already weakened markets.
He organized private bankers to lend to trust companies judged sound. On October 24, 1907, when overnight loans to brokers cost 100% a year, his firm lent $25 million on the Stock Exchange floor. According to Federal Reserve History, the exchange stayed open largely because of his actions. Stocks still fell to their low three weeks later.
By stock prices, no. The Dow fell 48.5% and passed its old record 9 years and 8 months after it. After 1929 it fell 89% and took 25 years.
Method. "Below the record" compares each close with 103.00, the January 19, 1906 close and the highest in the 1905 to 1914 data. Dow figures are price only; dividends were paid but are not in this index. The dividends-reinvested S&P composite figures add one twelfth of Shiller's annual dividend rate each month to the monthly price change and compound it, assuming no cost and no tax; they are accurate to about a month. The two indexes peaked at different times because they held different stocks: the Dow 12 industrial companies, the composite a much wider index of all common stocks, railroads included.
Historical data shown; past performance does not indicate future results. StockCram is an educational platform, not a broker-dealer or investment adviser, and nothing on this page is investment advice.
Every post in this series measures crashes the same way; our market-history method explains how.
The Dow fell 48.5% from January 1906 to November 15, 1907
About 70% of that fall came before the October 1907 bank runs. The worst single day was March 14, 1907, down 8.3%.
"40.9%" and "almost 50%" are both right
40.9% uses monthly averages from December 1906; 48.5% is close to close from the January 1906 record. Ask where a figure starts and what it measures.
Recovery: 27 months with dividends, almost 10 years by price
Peak to peak, the broad market with dividends was back in December 1908. On price alone, the Dow came within 2.4% of its record in November 1909 and passed it by September 1915; after 1929 the same measure took 25 years. The panic pushed Congress toward creating the Federal Reserve in 1913.
The Nasdaq fell 78% after March 2000 and took 15 years to regain its high. The S&P 500 fell 49%, was back by 2007, and has stayed above its 2000 record since 2013.
The Dow fell 89% after 1929 and took 25 years to regain its high by price. With dividends reinvested and deflation counted, the market was briefly back by 1936 and for good by 1949.
On October 19, 1987 the S&P 500 fell 20.47% in a day. What caused it, and when the market recovered: 21 months by price, about 19 with dividends, over 4 years after inflation.