Dot-Com Bubble Burst: How Long Did It Take to Recover?

The Nasdaq fell 78% after March 2000 and took 15 years to regain its high. The S&P 500 fell 49%, was back by 2007, and has stayed above its 2000 record since 2013.

Sean Sha
By Sean Sha15 min read

Educational purposes only. This content does not constitute investment advice. Read our disclaimer

StockCram is not a broker-dealer, investment adviser, or financial institution. All content is for educational and informational purposes only and should not be construed as personalized investment advice. Consult a qualified financial professional before making investment decisions. Past performance does not guarantee future results.
Dot-Com Bubble Burst: How Long Did It Take to Recover?
Share
15 min read

The dot-com bubble burst in March 2000. The Nasdaq Composite, an index weighted heavily toward technology companies, fell 78% and took 15 years to close back above its record. The broader S&P 500 fell 49% and first got back in 2007, but the 2007-2009 financial crisis took that recovery away. It has closed above its 2000 record at every trading-day close since March 5, 2013.

How long recovery took depends on which index you measure, whether you count dividends and inflation, and whether you mean the first day back or a lasting recovery. Counting reinvested dividends, an S&P 500 fund such as SPY has closed above its March 2000 value since December 2011.

Free · pretend money

Dot-Com Bubble simulator: what would you have done?

11 moments, real S&P 500 closes, about 6 minutes. You only see the news of each day.

Open the full page

Historical simulation with pretend money. Past performance does not indicate future results. Not investment advice.

Could you have held on through the dot-com crash? Our free replay starts you in December 1996 with $10,000 in pretend money: 60% in the broad market, 30% in the tech-heavy Nasdaq and 10% in cash. Then you make 11 decisions using only the news of each day, and see how you did against doing nothing.

The Dot-Com Bubble Burst at a Glance

Here, "recovered" means a closing price (the price at the end of a trading day) back above the 2000 record. Past performance does not guarantee future results.

  • ✓When it burst: the Nasdaq peaked on March 10, 2000 and the S&P 500 on March 24, 2000; the S&P 500 came within half a percent of its record again in September 2000.
  • ✓The fall: to the October 9, 2002 low, the Nasdaq lost 78% and the S&P 500 lost 49%.
  • ✓Nasdaq recovery: back above its record on April 23, 2015, after 15 years.
  • ✓S&P 500 recovery: back in May 2007, on and off through 2007, below from November 2007 until 2013, and above it at every close since March 5, 2013, through October 23, 2026.
  • ✓Monthly savers: someone adding $100 a month from March 2000 was back above what they had paid in by December 2003.

When Did the Dot-Com Bubble Burst?

The dot-com bubble burst in March 2000, though not on the same day for every index. For the Nasdaq Composite, the top was a record close of 5,048.62 on Friday, March 10, 2000. A month later it was in a bear market, the usual name for a fall of 20% or more from a high. On Wednesday, April 12, 2000 it closed at 3,769.63, 25.3% below the record. In the week of April 10 to 14 alone it lost a quarter of its value, including a 9.67% fall on Friday, April 14.

The broader market took longer to crack. The S&P 500 set its record of 1,527.46 on March 24, 2000, two weeks after the Nasdaq. As late as September 1, 2000 it closed within half a percent of that record. Its first close 20% below the record came on March 12, 2001, 11 months after the Nasdaq's. The Dow Jones Industrial Average, an average of 30 large US companies with far less technology in it, had peaked earlier still, on January 14, 2000.

All three hit their lowest close of the dot-com bust on the same day: Wednesday, October 9, 2002, about two and a half years after the bubble burst. The 2007-2009 financial crisis later took the S&P 500 and the Dow lower still, in March 2009.

Dot-Com Bubble Timeline: Key Dates From 1996 to 2016

The dot-com bubble from the first warning to the last recovery, measured on closing prices. Historical data shown; past performance does not indicate future results.

1996

A warning about "irrational exuberance"

December 5, 1996

Fed chair Alan Greenspan asked in a speech how anyone could know when "irrational exuberance" had pushed prices too high. That day's Nasdaq close: 1,300.12.

2000

The Nasdaq peaks

March 10, 2000

Record close for the Nasdaq Composite: 5,048.62. The S&P 500 set its own record two weeks later, on March 24, at 1,527.46.

2000

The first big sell-off

April 10 to 14, 2000

In one week the Nasdaq lost 25.3%, including 9.67% on Friday, April 14.

2001

Recession and September 11

March to November 2001

The US economy was in recession. After the September 11 attacks, stock markets closed for four trading days, and the Dow fell 7.1% when they reopened on September 17.

2002

The bottom

October 9, 2002

Both indexes hit bottom: the Nasdaq 78% below its record, the S&P 500 49% below its own.

2007

The S&P 500 gets back, briefly

May 30, 2007

The S&P 500 closed above its 2000 record for the first time. From November 2007, as the financial crisis began, it stayed below until 2013.

2013

The S&P 500 stays back

March 5, 2013

From this day the S&P 500 closed above its 2000 record at every close, through October 23, 2026.

2015

The Nasdaq gets back

April 23, 2015

First close above the March 2000 record, at 5,056.06. It has closed above it since November 7, 2016.

How Much Did the Stock Market Drop in the Dot-Com Crash?

How much the stock market dropped in the dot-com crash came down to which part of it you held: from each index's record close to its low on October 9, 2002, the Nasdaq Composite fell 78%, the S&P 500 fell 49% and the Dow fell 38%. The often-quoted 78% is the Nasdaq. If you had owned an index fund tracking the S&P 500, you would have lost about half from the March 2000 peak to the 2002 low, not four-fifths.

In 2000 alone, from the last close of 1999 to the last close of 2000, the S&P 500 fell about 10% by price and the Nasdaq 39%. Two more losing years followed: about 13% and 23% for the S&P 500 in 2001 and 2002, and about 21% and 32% for the Nasdaq.

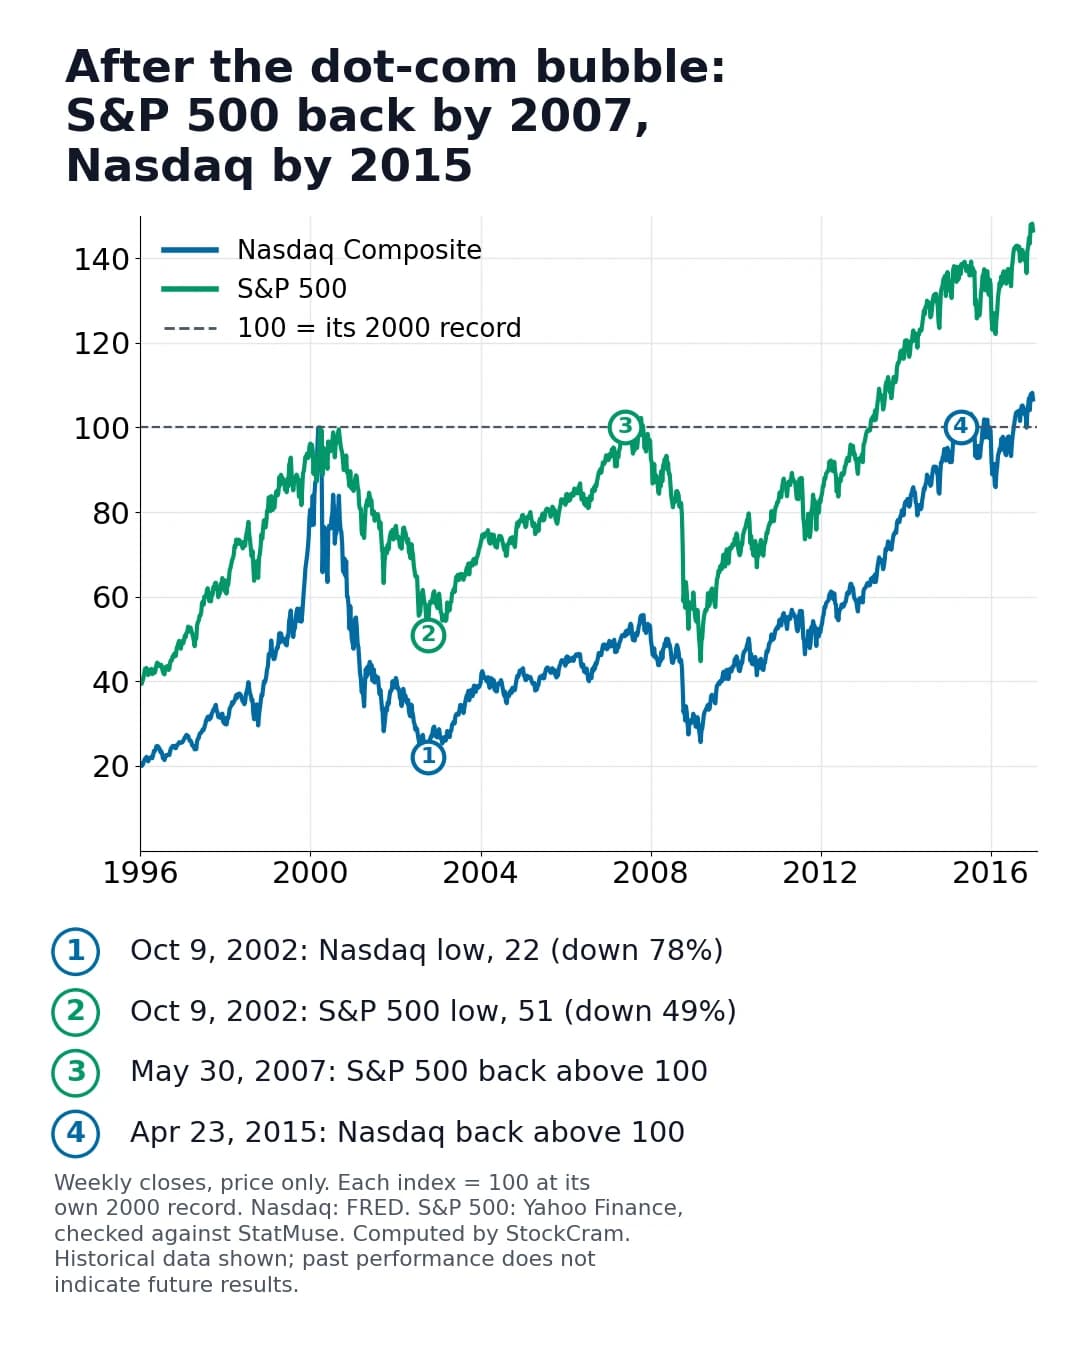
The Nasdaq and the S&P 500 after the dot-com bubble, each set to 100 at its 2000 record
Line chart of weekly closes, 1996 to 2016, with each index set to 100 at its own 2000 record close, price only, and the October 9, 2002 daily low marked: the Nasdaq at 22 and the S&P 500 at 51. The S&P 500 got back to 100 in May 2007, fell below its 2002 low in March 2009, and stayed above 100 from March 2013; the Nasdaq got back in April 2015. Nasdaq closes from FRED, S&P 500 closes from Yahoo Finance checked against StatMuse. Historical data shown; past performance does not indicate future results.
The dot-com crash: record, low and fall for each index (closing prices)

"$10,000 became" follows $10,000 from each index's record close to its low on October 9, 2002, price only, without dividends. Historical data shown; past performance does not indicate future results.

IndexRecord closeLow close (Oct 9, 2002)Fall$10,000 became
Nasdaq Composite5,048.62 (Mar 10, 2000)1,114.11-78%$2,207
S&P 5001,527.46 (Mar 24, 2000)776.76-49%$5,085
Dow Jones Industrial Average11,722.98 (Jan 14, 2000)7,286.27-38%$6,215

How Long Did It Take to Recover From the Dot-Com Bubble?

By price, recovering from the dot-com bubble took 15 years for the Nasdaq and 7 to 13 years for the S&P 500. That is 7 years to the S&P 500's first close back and 13 until it stayed back. On April 23, 2015, the Nasdaq Composite closed at 5,056.06, its first close above the March 10, 2000 record. The wait was shorter for the S&P 500. It first closed above its March 24, 2000 record on May 30, 2007, slipped below it often that summer, and from November 1, 2007, as the financial crisis began, stayed below it until 2013. In March 2009 it fell to 676.53, 56% below its 2000 record and lower than its 2002 low. From March 5, 2013, it did not close below that 2000 record again, through October 23, 2026. (Its 2007 record of 1,565.15 is a different line; it passed that on March 28, 2013.)

Dividends, the cash many companies pay their shareholders, shorten the wait. SPY, a fund that tracks the S&P 500, shows the difference. With dividends reinvested, it first closed above its March 2000 value on October 26, 2006, by our calculation from its dividend-adjusted prices. It hovered around that level for a few weeks, fell below again in January 2008, and has closed above it at every close since December 21, 2011. If you hold a different S&P 500 index fund, your figures can differ slightly because of fees, tracking differences, taxes and dividend timing.

Inflation lengthens the wait. Measured by price in March 2000 dollars, both indexes slipped back below the line in later sell-offs, most recently in the March 2020 crash, which is why those rows reach 2020. With dividends counted too, the S&P 500 stayed above from 2013. We do not show a Nasdaq row with dividends because we could not find a free long-run daily series for it.

For comparison, measured the same way, the S&P 500 took 23 months by price to pass its August 1987 record (21 months after Black Monday itself). The Dow took about 25 years to pass its 1929 record, and about 9 years and 8 months after its January 1906 record in the Panic of 1907.

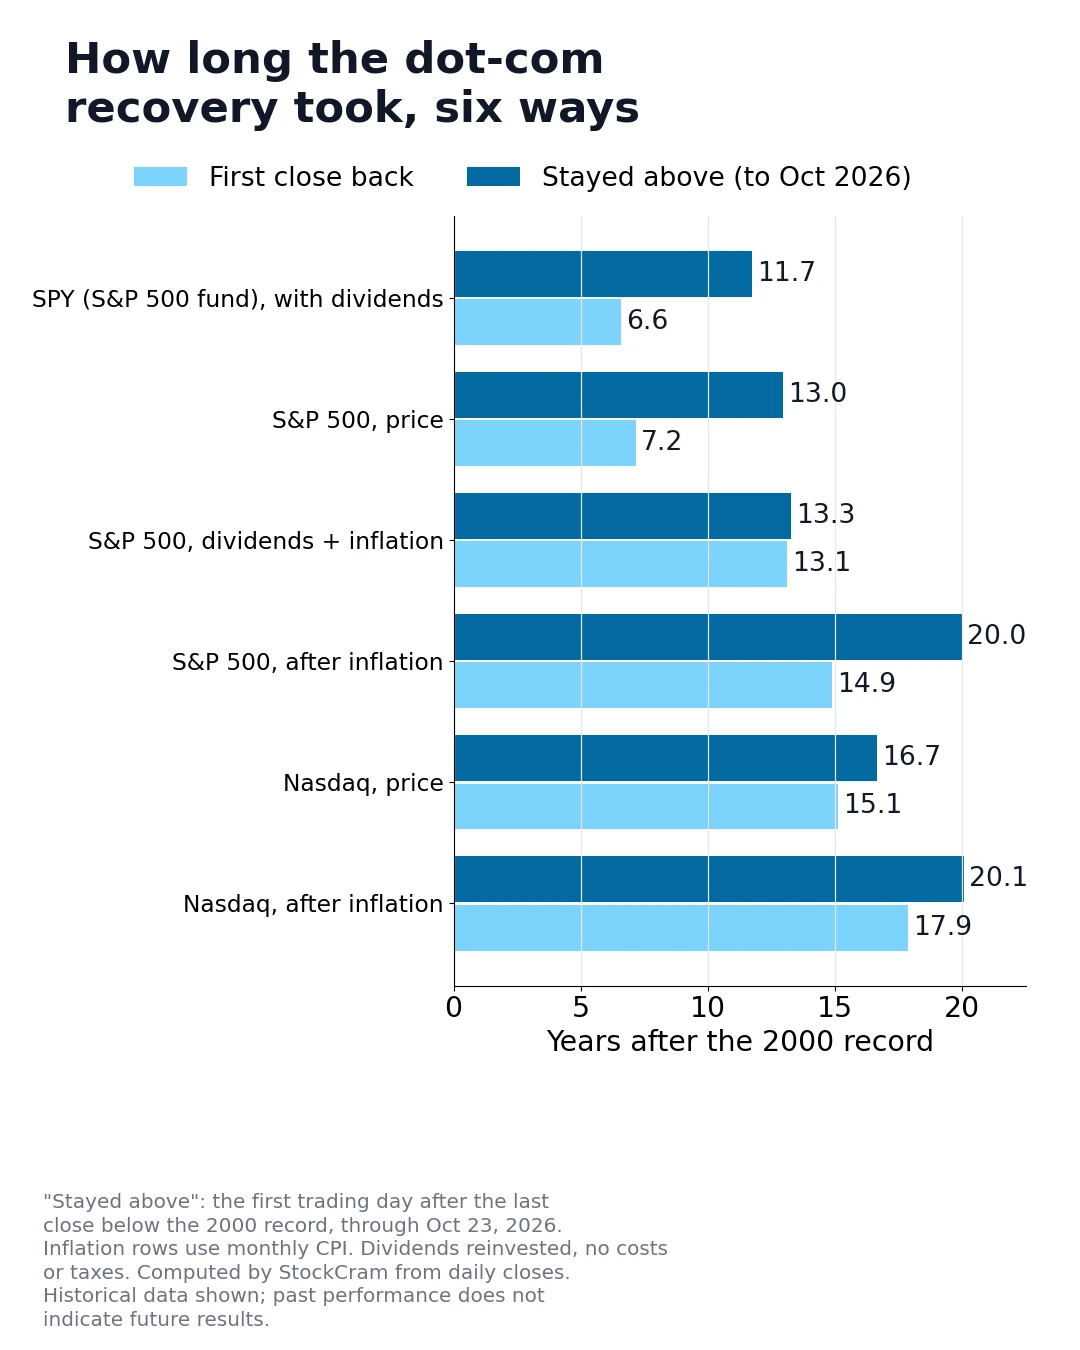
Years to get back above the 2000 record: first close back, and staying above
Bar chart of six of the measures in the table above (all but the Dow). For each, one bar shows the years to the first close above the 2000 record and a second shows the years until it stayed above, through October 2026. The S&P 500 by price: 7.2 and 13.0 years. The Nasdaq by price: 15.1 and 16.7 years. Historical data shown; past performance does not indicate future results.
How long the dot-com recovery took, by measure

"First close back" is the first close above the 2000 record. "Stayed above from" is the first trading day after the last close below it, through October 23, 2026; a later fall below the record would change it. Times are counted from each index's own record, in whole months. Inflation rows use the monthly consumer price index, so they are accurate to the month. SPY's row uses its own dividend-adjusted closes, which include its small fund fees; the other dividend row uses the index rebuilt with dividends, reinvested with no costs or taxes (Robert Shiller's monthly data agrees on May 2013; SPY's own prices give September 2013 for the row's second date, because of its fees). Historical data shown; past performance does not indicate future results.

MeasureFirst close backTime to first close backStayed above fromTime to stay above
S&P 500 index fund (SPY), dividends reinvestedOct 26, 20066 years 7 monthsDec 21, 201111 years 8 months
S&P 500, priceMay 30, 20077 years 2 monthsMar 5, 201312 years 11 months
S&P 500, dividends reinvested, after inflationMay 201313 years 1 monthJul 201313 years 3 months
S&P 500, price, after inflationFeb 201514 years 10 monthsMar 202020 years
Dow, priceOct 3, 20066 years 8 monthsNov 30, 201111 years 10 months
Nasdaq Composite, priceApr 23, 201515 years 1 monthNov 7, 201616 years 7 months
Nasdaq Composite, price, after inflationJan 201817 years 10 monthsApr 202020 years

What If You Kept Investing Every Month Through the Dot-Com Crash?

If you had kept investing every month through the dot-com crash, your account would have climbed back above the money you paid in. It got there years before a single sum invested at the peak recovered. Take $100 put into an S&P 500 index fund on the first trading day of every month from March 2000, with dividends reinvested. At its lowest point in the dot-com bust, on July 23, 2002, the account held $1,899 against $2,900 paid in: 35% less than had gone in, a shortfall against deposits rather than the account's own fall from a high. By December 12, 2003, three years and nine months after the first $100, it was back above everything paid in. A single sum invested at the March 2000 peak needed until October 2006. The two investors put in different amounts at different times, so the comparison shows how the timing of deposits changes the wait.

That happened because the later deposits bought more of the fund after prices had fallen, an approach called dollar-cost averaging. Being above the money paid in is a low bar: it counts dollars, not what those dollars could buy, and not what the money might have earned elsewhere. The same account fell below what had been paid in again during the 2007-2009 crisis. On our reconstruction of the index with dividends, it stayed above from mid-2010. The example assumes no fees or taxes and a fixed $100 a month; Sources and Method gives the details. You can try other amounts in our DCA vs lump sum calculator. It worked here because the S&P 500 recovered; a different market or time could look different. Past performance does not guarantee future results.

Why Do Dot-Com Recovery Figures Range From 7 to 17 Years?

Published answers to how long the dot-com recovery took mostly run from about 7 to 17 years, and counting inflation and a lasting recovery stretches it to 20. Four choices explain the spread:

  • Which index: the S&P 500, the Nasdaq Composite, or a narrower one such as the S&P 500 Information Technology sector, which holds only the technology companies inside the S&P 500.
  • Dividends: counting them brings an S&P 500 fund back sooner.
  • Inflation: you needed about $145 in January 2018 to buy what $100 bought in March 2000, so counting what a dollar could buy (real return) adds years.
  • First touch or lasting recovery: staying above takes longer than touching the old high once.

One date often gets mixed up. Some pages say the Nasdaq recovered in May 2013, but its closes that month ran from 3,299 to 3,502, about a third below the 2000 record. May 2013 is when the S&P 500, with dividends and after inflation, first got back. It is not a Nasdaq date.

What a dot-com recovery figure usually means

Each figure is counted from the index's own 2000 record to the date shown. Historical data shown; past performance does not indicate future results.

If a source saysIt usually meansDate
About 7 yearsS&P 500 by price, first close backMay 30, 2007
About 13 yearsS&P 500 by price, stayed aboveMar 5, 2013
About 15 yearsNasdaq Composite by price, first close backApr 23, 2015
About 17 yearsS&P 500 Information Technology sector by priceJul 19, 2017
About 18 yearsNasdaq Composite after inflation, first close backJan 2018
About 20 yearsEither index after inflation, stayed aboveMar and Apr 2020

How Long Did the Dot-Com Bubble Last?

The dot-com bubble's rise lasted several years and its bust about two and a half. There is no agreed date for when the rise began. One marker of how far it had already run is a speech on December 5, 1996. In it, Federal Reserve chair Alan Greenspan asked how anyone could know "when irrational exuberance has unduly escalated asset values." From that day's close of 1,300.12, the Nasdaq rose almost fourfold to its record over the next 3 years and 3 months. In the same years the S&P 500 roughly doubled to its own record. The bust then ran about two and a half years, from the Nasdaq's record on March 10, 2000 to its low on October 9, 2002.

Why Did the Dot-Com Bubble Burst?

Several pressures arrived together, and prices had run far ahead of profits. Jay Ritter, a University of Florida professor who tracks IPOs, counted 856 IPOs in 1999 and 2000 in his sample of operating companies priced at $5 a share or more. Of those, 78% had lost money in the year before going public, against 32% from 1990 to 1998. The internet did change the world; that did not mean every internet company was worth the price investors paid for it. Between June 1999 and May 2000, the Federal Reserve raised its target for the federal funds rate six times, from 4.75% to 6.5%. That is the rate banks charge each other for overnight loans, and raising it pushes up borrowing costs across the economy. One sharp sell-off came on Monday, April 3, 2000. After talks to settle the government's antitrust case against Microsoft (a case about unfair competition) broke down over the weekend, the Nasdaq fell 7.6% that day. A judge ruled against Microsoft after trading had closed.

The decline did not stop with the internet companies. The Fed began cutting rates on January 3, 2001. A US recession followed, from March to November 2001, by the dating of the National Bureau of Economic Research. Stock markets stayed closed for four trading days after the September 11, 2001 attacks, and the Dow fell 7.1% when they reopened on September 17. Accounting scandals then hit confidence again before the October 2002 low. Enron filed for bankruptcy on December 2, 2001, and WorldCom on July 21, 2002.

How Did a Mixed Portfolio Do in the Dot-Com Crash?

A portfolio's mix changes even if you never trade. In our replay, $10,000 starts on December 4, 1996 as $6,000 in the S&P 500, $3,000 in the Nasdaq and $1,000 in cash. Left untouched, the tech-heavy Nasdaq part grew from 30% to 48.8% of the money by March 10, 2000, because it rose fastest. The whole mix peaked at $24,780, up 147.8%, on March 24, 2000. At the October 9, 2002 low it was worth $9,832, 1.7% below where it began. These are game results based on index prices only, before dividends, fees or taxes. Past performance does not guarantee future results.

Resetting a mix to its starting percentages is called rebalancing. The portfolio allocation lesson explains how it works. It cuts both ways: trimming technology in 1998 meant owning less of the climb as well as less of the fall. The dot-com replay lets you watch the drift happen, decision by decision.

Frequently Asked Questions About the Dot-Com Bubble Burst

Quick answers on the dot-com crash and the recovery, from the same daily closing prices as the rest of this page.

Measured by price, the S&P 500 took 7 years to first close back above its March 2000 record (May 30, 2007) and 13 years to stay above it (from March 5, 2013). The Nasdaq Composite took 15 years (April 23, 2015).

By closing price, the Nasdaq Composite first closed above its March 10, 2000 record of 5,048.62 on April 23, 2015. It dipped below that level again and has closed above it since November 7, 2016. It did not recover in May 2013, as some pages say.

By price, the S&P 500 first closed above its March 24, 2000 record of 1,527.46 on May 30, 2007. It moved above and below that level through 2007, stayed below from November 1, 2007, and has stayed above it since March 5, 2013. With dividends reinvested, an S&P 500 fund stayed above its March 2000 value from December 2011.

On October 9, 2002, the Nasdaq Composite closed at 1,114.11, 77.9% below its March 10, 2000 record and its lowest close since August 1, 1996. Both the S&P 500 and the Dow hit their dot-com lows the same day; both fell lower still in March 2009, during the financial crisis.

Pets.com sold shares to the public in February 2000 and closed its online store on November 10, 2000. eToys told about 700 of its roughly 1,000 employees in January 2001 that their jobs would end, and filed for bankruptcy on March 7, 2001. Webvan, an online grocer, filed for bankruptcy on July 13, 2001. The dates come from the companies' own filings with the SEC.

Often far longer than the indexes, and many never did. Amazon fell more than 90% from its December 1999 record and first closed above it on October 23, 2009. Microsoft did not close above its December 27, 1999 record until October 21, 2016, almost 17 years later; with dividends reinvested, it got back on July 16, 2014. Cisco, which made much of the networking equipment the internet ran on, closed at a record $80.06 on March 27, 2000, fell almost 90% by October 2002, and did not close above that price again until December 10, 2025. Counting reinvested dividends, on Yahoo Finance and StatMuse dividend-adjusted prices, it first passed its March 2000 value on August 24, 2021. Indexes recover partly because their members change: companies that fail or shrink drop out and growing ones join. Past performance does not guarantee future results.

Nobody can know that in advance, and this page does not try to say. Our post Are We in Another AI Bubble? sets out the arguments on both sides. What the dot-com years can show is how long recovery took for each kind of holding, which is what this page measures.

Sources and Method

Method. "Recovered" means a closing price above the 2000 record close. It does not mean investors felt whole, kept their purchasing power or avoided taxes and fees. "Stayed above from" is the first trading day after the last close below the record, through October 23, 2026. SPY figures follow $1 invested at SPY's dividend-adjusted close on March 24, 2000, the S&P 500's record day; that adjusted close treats each dividend as reinvested on its ex-dividend date and already includes the fund's fees. The monthly example is a separate calculation (SPY to 2007, then the rebuilt index): it buys fractional fund units at each month's first closing price, values the account at every daily close and reinvests dividends. Durations are counted from each index's own record. Figures are price only unless they say dividends. Data checked October 26, 2026: daily closes through October 23, 2026; consumer prices through September 2026. This page is historical education, not investment advice. Historical data shown; past performance does not indicate future results.

Every post in this series measures crashes the same way; our market-history method explains how.

Key Takeaways

•

The bubble burst in March 2000; the fall ended on October 9, 2002

The Nasdaq fell 78% and the S&P 500 49%.

•

By price, the Nasdaq took 15 years to get back; the S&P 500 took 7 to 13

Seven to its first close back in 2007, thirteen to stay back from 2013.

•

Investing every month got an account back above its deposits sooner

$100 a month from March 2000 was back above what had been paid in by December 2003, a lower bar than a full recovery. Past performance does not guarantee future results.

•

"May 2013" is not a Nasdaq recovery date

It is when the S&P 500, with dividends and after inflation, first got back. The Nasdaq closed back above its record on April 23, 2015.

•

Try the decisions yourself

Play the free dot-com replay: 11 decisions from 1996 to 2002.

Enjoyed this article?

Share

Related Articles