
Dot-Com Bubble Burst: How Long Did It Take to Recover?
The Nasdaq fell 78% after March 2000 and took 15 years to regain its high. The S&P 500 fell 49%, was back by 2007, and has stayed above its 2000 record since 2013.
15 min read
Read Article
On October 19, 1987 the S&P 500 fell 20.47% in a day. What caused it, and when the market recovered: 21 months by price, about 19 with dividends, over 4 years after inflation.

Educational purposes only. This content does not constitute investment advice. Read our disclaimer
StockCram is not a broker-dealer, investment adviser, or financial institution. All content is for educational and informational purposes only and should not be construed as personalized investment advice. Consult a qualified financial professional before making investment decisions. Past performance does not guarantee future results.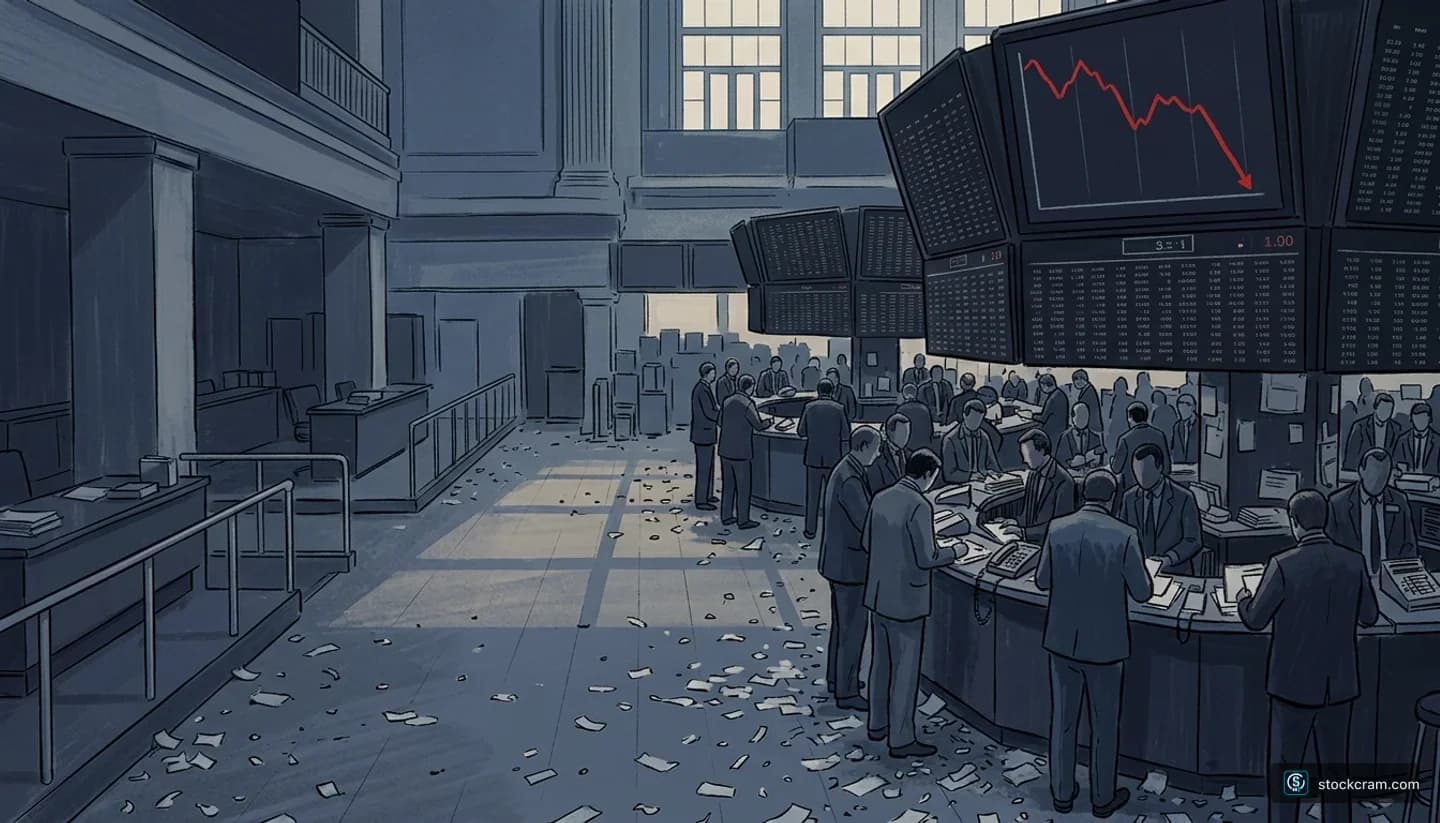
On Black Monday, October 19, 1987, the Dow fell 22.6% and the S&P 500 fell 20.47% in a single session, a day the Federal Reserve's history calls the largest one-day stock market decline in history.
The short answer on recovery: the S&P 500 took 21 months to get back above its pre-crash record by price (July 26, 1989), about 19 months counting reinvested dividends, and over four years if you also adjust the price for inflation. Published figures disagree because they measure from different starting points, so this page shows each one.
Free · pretend money
Black Monday 1987 simulator: what would you have done?
11 moments, real S&P 500 closes, about 6 minutes. You only see the news of each day.
Historical simulation with pretend money. Past performance does not indicate future results. Not investment advice.
What happened that week, how long the recovery took measured six ways, what caused the crash, how it compares with 1929, and what today's circuit breakers would do with a fall that size. (Published October 19, 2026, the crash's 39th anniversary.)
On Black Monday, October 19, 1987, the S&P 500 fell 20.47% in a single day, from 282.70 to 224.84. Over the same session, the Dow Jones Industrial Average fell 508 points, or 22.6%, from 2,246.74 to 1,738.74.
A few things help read those numbers. An index point is just the unit an index is quoted in; what matters is the percentage. Of the two, the Dow follows 30 large companies and weights them by share price, while the S&P 500 follows 500 and weights them by company size, so the two rarely move by exactly the same percentage. And a 20% index decline is the combined move of its stocks, weighted the way the index weights them: some stocks fell much more that day and some fell less.
How long the recovery took depends on how you measure it. The six versions are in the recovery section below.
The crash was the end of a week-long slide. By late August 1987 the Dow had gained 44% in seven months, according to the Federal Reserve's history of the crash. In mid-October a larger-than-expected trade deficit was reported and the dollar fell. Markets dropped hard from October 14, and on Friday, October 16, the Dow lost 4.6%.
The weekend gave only a brief pause. On Monday, markets in Asia fell before New York opened, and the Fed's history notes that New Zealand's market eventually fell 60%. In New York, the Dow "crashed at the opening bell" and finished down 508 points, while the S&P 500 closed at 224.84, down from 282.70 on Friday.
In money terms: $1,000 invested at the August record was worth $839 by Friday's close and $668 by Monday's close. Monday was not the bottom, either: the index's lowest close came weeks later, on December 4, 1987, at 223.92, down 33.5% from the record, the deepest drawdown of the episode.
The next morning, October 20, the Federal Reserve said in a statement that it "affirmed today its readiness to serve as a source of liquidity to support the economic and financial system." In practice, the Fed signaled it would supply cash if the financial system needed it, and the Fed's history says it encouraged banks to keep lending on their usual terms.
To see those days from the inside, one decision at a time, try our Black Monday 1987 simulator, a free replay with pretend money.
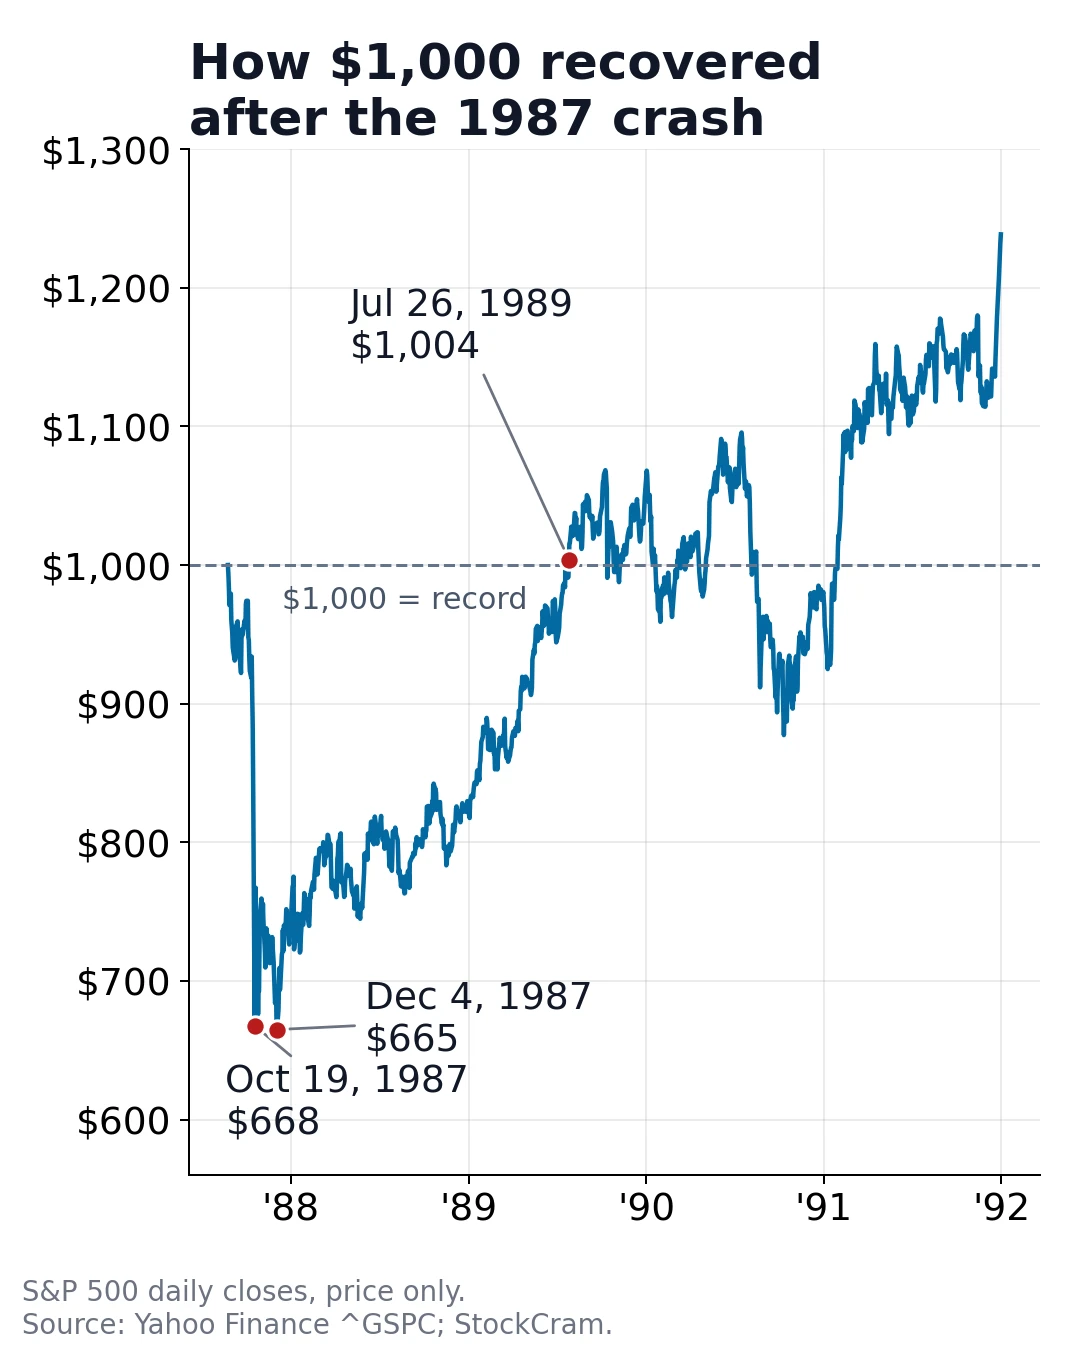
Computed by StockCram from daily S&P 500 closes. Dividends not included. Historical data shown; past performance does not indicate future results.
| Date | S&P 500 close | Value of $1,000 |
|---|---|---|
| Aug 25, 1987 (record close) | 336.77 | $1,000 |
| Fri, Oct 16, 1987 | 282.70 | $839 |
| Mon, Oct 19, 1987 (Black Monday) | 224.84 | $668 |
| Dec 4, 1987 (lowest close) | 223.92 | $665 |
| Jul 26, 1989 (back above the record) | 338.05 | $1,004 |
The answer depends on two choices: which level counts as "recovered", and whether you count dividends and inflation. Each date below is the first trading day the index closed at or above its starting level.
"About 20 months", another common figure, matches total return measured from the August peak, or price measured from the December 4 low.
To check the four S&P 500 rows that use the August record, we repeated them with Robert Shiller's monthly average prices, a separate data series and a cruder method. It puts the price recovery in July 1989, total return in May 1989, real total return in August 1989 and real price in January 1992, all within about a month of the daily figures. Both checks lean on related underlying data, so treat the dividend and inflation dates as accurate to the month, not the day.
If "dividends reinvested" is new to you, our lesson on what an index fund is explains how most index funds handle dividends. To see how inflation shrinks a return, try the inflation-adjusted return calculator.
Key Takeaway: Ask which line is being measured. About a year by the softest measure, 21 months by price, over four years after inflation.
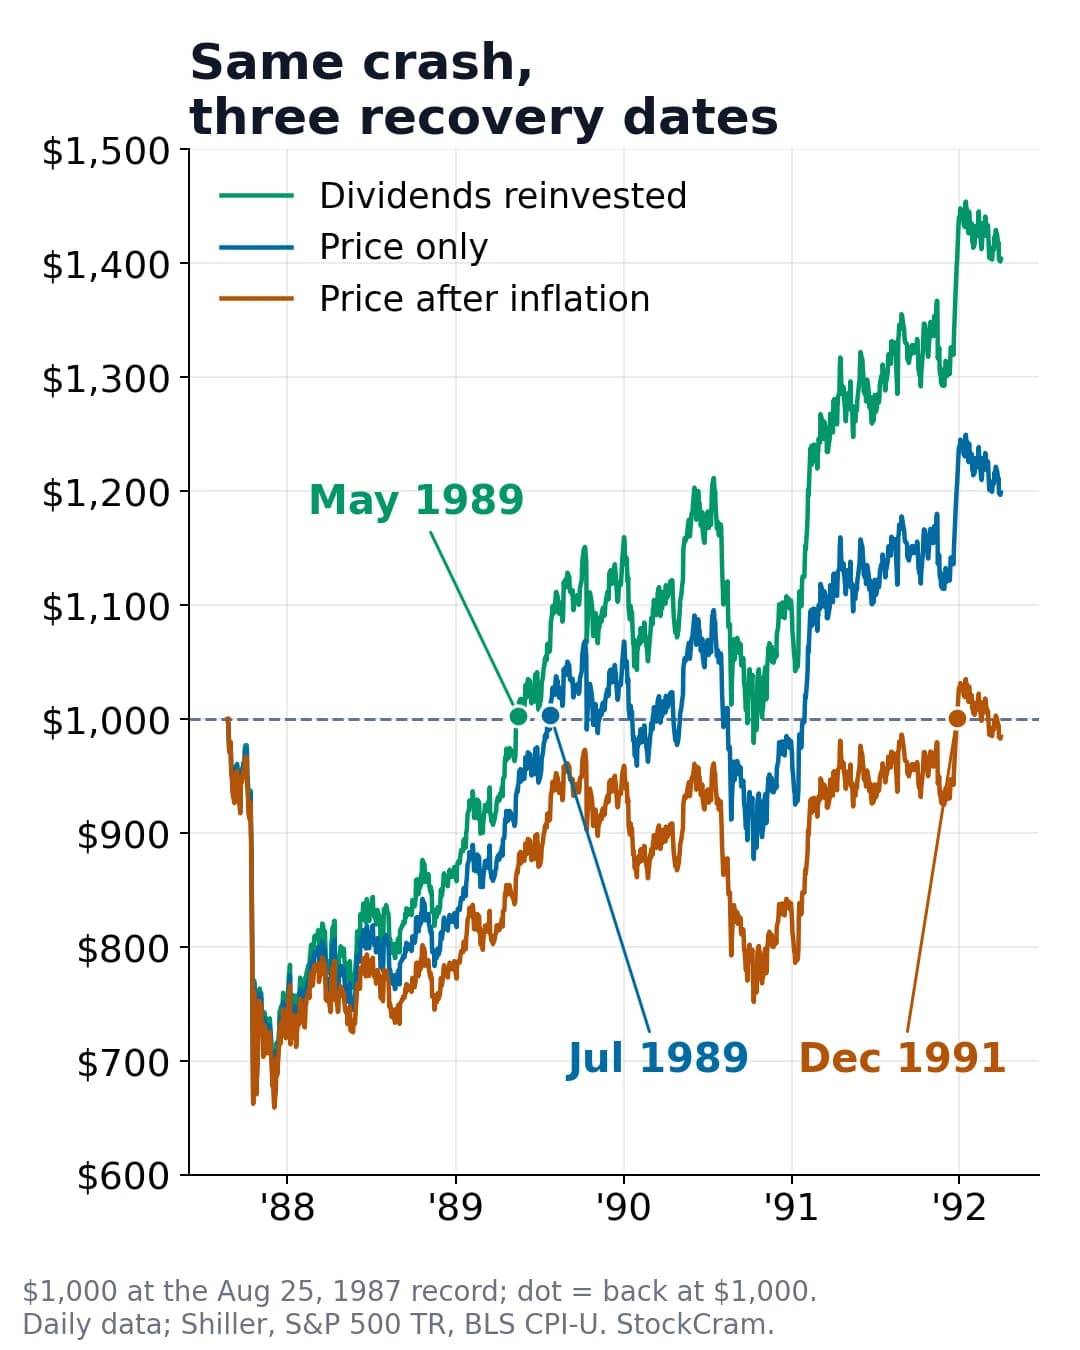
Each row is a different question, not a competing estimate of the same one. "Recovered on" is the first close at or above the starting level. Price-only rows use daily closes; rows with dividends or inflation are approximate because those inputs are monthly. Method and data: see Sources and Method. Historical data shown; past performance does not indicate future results.
| Starting Level | Dividends | Inflation | Recovered On | Time After Crash |
|---|---|---|---|---|
| Close on Fri, Oct 16, 1987 (282.70) | No | No | Oct 20, 1988 | 1 year, 1 day |
| Record close, Aug 25, 1987 (336.77) | Reinvested | No | Mid-May 1989 | About 19 months |
| Record close, Aug 25, 1987 (336.77) | No | No | Jul 26, 1989 | 21 months, 7 days |
| Dow record close, Aug 25, 1987 (2,722.42) | No | No | Aug 24, 1989 | 22 months, 5 days |
| Record close, Aug 25, 1987, in buying power | Reinvested | Adjusted | Late Jul to Aug 1989 | About 21 to 22 months |
| Record close, Aug 25, 1987, in buying power | No | Adjusted | Late Dec 1991 to Jan 1992 | About 4 years, 2 to 3 months |
No single cause explains the October 1987 crash. Looking back, the Federal Reserve's history of the crash lists the factors regulators and economists identified afterward:
A simplified illustration of how portfolio insurance could feed on itself (hypothetical, not a reconstruction of any real 1987 fund): a fund with $100 million in stocks follows a rule to cut its stock exposure as prices fall, and does it by selling stock-index futures. Prices dip, so it sells. If thousands of funds follow similar rules, they sell at the same moment, which pushes prices down further and triggers the next round of selling under the same rules.
The names get mixed up because 1929 had its own black days. Black Thursday was October 24, 1929, when panic selling began on about three times the normal trading volume. On Black Monday, October 28, 1929, the Dow fell nearly 13%, and on Black Tuesday, October 29, nearly 12% more. Black Monday 1987 is the October 19 crash on this page, and it is the one people usually mean today.
The bigger difference was the aftermath. According to the Federal Reserve's history, the 1987 losses "were not followed by an economic recession or a banking crisis." After 1929, the slide ran until the summer of 1932, when the Dow closed 89% below its peak. It took until November 1954 for the Dow to return to its 1929 high. The 1987 recovery, by contrast, is measured in months. For a slow bubble deflating rather than a one-day crash, the closer comparison is the dot-com bust. After peaking on March 24, 2000, the S&P 500 fell 49% to October 9, 2002, and did not close above its 2000 peak again until May 30, 2007, more than seven years later. Our AI bubble explainer covers that comparison, and our guide to how stocks performed during past wars covers other shocks. The 1929 crash, day by day, and how long its recovery really took, measured four ways, is in our post on the 1929 stock market crash and Black Tuesday. An earlier panic, in 1907, took the Dow down 48.5% over 22 months, most of it before the bank runs began; that story is in our post on the Panic of 1907.
Today's rules would interrupt a fall like 1987's. After the crash, exchanges added market-wide circuit breakers: pauses in trading across U.S. stock markets, triggered by how far the S&P 500 has fallen from the previous day's close. According to the SEC, a 7% (Level 1) or 13% (Level 2) drop before 3:25 p.m. Eastern halts trading for 15 minutes; at or after 3:25 p.m. those two levels do not halt trading. A 20% drop (Level 3) at any time halts trading for the rest of the day.
Under today's rules, a 20% fall in the S&P 500 would end trading for the day. That does not tell us where a 1987-style day would have closed, because halts change how traders behave, nor does it determine what happens in the trading sessions that follow.
For illustration only, using the closes on Friday, October 16, 2026 (the thresholds reset every day), a 20.47% fall in the S&P 500 would be about 1,568 points, and the Dow's 22.6% would be about 11,750 points. For scale, the S&P 500's largest one-day percentage fall since 1987, through October 16, 2026, was 11.98% on March 16, 2020.
Circuit breakers pause trading. They do not set a floor under prices. The historical record shows how 1987 unfolded; it cannot forecast whether or when a fall like it happens again.
Thresholds from the SEC (Investor.gov). Point figures use the S&P 500 close of 7,659.44 on Friday, October 16, 2026; the exchanges reset them daily from the prior close. These point values are an illustration from that date, not current thresholds.
| Level | S&P 500 decline | Points (Oct 16, 2026 close) | What Happens |
|---|---|---|---|
| Level 1 | 7% | About 536 points | 15-minute market-wide halt if hit before 3:25 p.m. ET |
| Level 2 | 13% | About 996 points | 15-minute market-wide halt if hit before 3:25 p.m. ET |
| Level 3 | 20% | About 1,532 points | Trading stops for the rest of the day, at any time |
| 1987 for comparison | 20.47% | About 1,568 points | No market-wide halt existed; trading ran to the close |
Short answers to the questions people ask most about the October 19, 1987 crash.
The stock market crash of October 19, 1987. The Dow fell 22.6% and the S&P 500 fell 20.47% in one day, and markets in Asia and elsewhere fell too.
The Dow lost 508 points (22.6%) and the S&P 500 lost 20.47%. $1,000 in the S&P 500 at Friday's close was worth about $795 by Monday's close.
21 months by price (July 26, 1989). About 19 months with dividends reinvested. Over four years if you adjust the price for inflation.
A fast run-up in prices, automated portfolio insurance selling that fed on itself, a bad trade deficit report and a falling dollar, and markets that could not pause or settle trades consistently.
Crashes are often named for their weekday, like Black Thursday and Black Tuesday in 1929. October 19, 1987 was a Monday.
Yes. A 20% S&P 500 fall triggers Level 3, which halts trading for the rest of the day. In 1987 there was no such rule.
Method. A recovery date is the first trading day the index closed at or above the starting level. Total return from August 25, 1987: Shiller's dividend figure for each month is an annual rate (the trailing four-quarter total), so we divide it by 12 to get that month's dividend, spread it evenly over the month's trading days, and add it to the daily price change. On January 4, 1988 the series switches to the official S&P 500 Total Return index, rescaled so both series have the same value that day, so there is no jump at the join. Inflation-adjusted values divide each day's level by that month's CPI-U (a second version interpolating CPI between months gives dates within a few days of the first). The 2026 point figures use the October 16, 2026 closes of 7,659.44 (S&P 500) and 52,002.41 (Dow). Dot-com and 2020 figures use the same daily S&P 500 data.
Historical data shown; past performance does not indicate future results. StockCram is an educational platform, not a broker-dealer or investment adviser, and nothing on this page is investment advice.
Every post in this series measures crashes the same way; our market-history method explains how.
October 19, 1987: S&P 500 -20.47%, Dow -22.6%
The bottom by closing price came seven weeks later, on December 4, 1987.
Recovery took 1 to 4+ years depending on the measure
21 months by price, about 19 with dividends reinvested, over four years for price after inflation.
Today a 20% S&P 500 fall halts trading for the day
In 1987 there was no market-wide circuit breaker.
The Nasdaq fell 78% after March 2000 and took 15 years to regain its high. The S&P 500 fell 49%, was back by 2007, and has stayed above its 2000 record since 2013.
The Dow fell 89% after 1929 and took 25 years to regain its high by price. With dividends reinvested and deflation counted, the market was briefly back by 1936 and for good by 1949.
The Dow fell 48.5% from its January 1906 high to its November 1907 low, mostly before the October bank runs. Recovery came in 1908 counting dividends, and in 1915 by Dow price.