
Free · No signup · Real 1987–1989 prices
Black Monday 1987 simulator
Market Rewind · Historical simulation
January 1987. You have $10,000 in pretend money.
It starts invested in the S&P 500, an index of large US companies. At 11 moments, choose how much stays in stocks and how much moves to cash. Future prices stay hidden while you play.
How the Black Monday 1987 simulation works
You start in January 1987 with $10,000 in pretend money, invested in the S&P 500. The replay stops at 11 moments, each with the news people had that day. At each one you choose how much to keep in stocks: all of it, half, a quarter or none. Future prices stay hidden until you continue, so you decide with what was known at the time.
How the Black Monday 1987 replay calculates results
A change you make trades at that day's closing level. Between decisions nothing is rebalanced, so the share of your money in stocks moves with prices. Cash earns no interest, and fees, spreads, slippage and taxes are ignored. These are simplifications: on a fast-moving day a real order could not count on the closing price. The score at the end describes the choices you made in this simulation, not your investing ability, and it does not reward the highest balance.
Where the Black Monday 1987 prices come from
S&P 500 index closing prices (price only, dividends not included), from StatMuse, each checked against Yahoo Finance. The same figures as our Black Monday 1987 article.
Read the history behind the replay
For what happened, what caused it and how the recovery is measured, read Black Monday 1987: causes, crash and recovery timeline. Related terms: market crash, panic selling, loss aversion.
Black Monday 1987 in brief
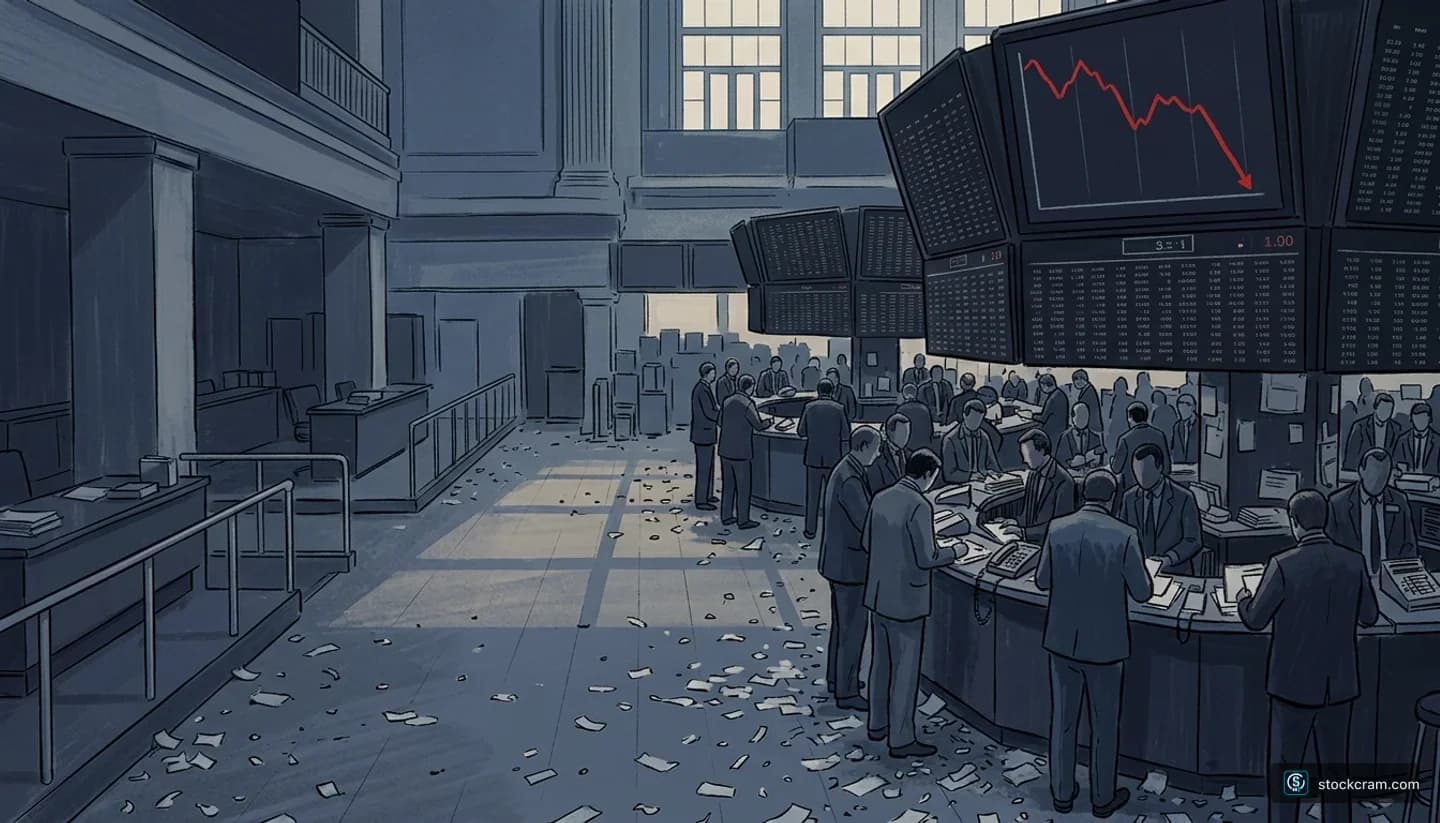
On Monday, October 19, 1987 the S&P 500 fell 20.5% in a single day, still its biggest one-day fall, and the Dow lost 22.6%. There was no market-wide circuit breaker at the time. Read the full story
Black Monday 1987 simulator: questions
Is the Black Monday 1987 simulator free?
Yes. It is free, needs no account, and uses pretend money. Nothing you do in it touches a real account.
Does the simulator use real 1987 market data?
Yes. Every price is a real S&P 500 closing level from January 1987 to July 1989, taken from StatMuse and checked against Yahoo Finance. The figures match our Black Monday 1987 article.
How long does a run take?
About six minutes for all 11 moments. You can also skip to the end at any point and see how leaving your money alone would have turned out.
Does the simulator show when to buy or sell?
No. It is a historical replay for education. It shows how one stretch of history played out for the choices you made, and it cannot give a rule for when to buy or sell. Past performance does not indicate future results.
Is the simulator based on what really happened?
Yes. The 11 moments follow the real news from January 1987 to July 1989, including October 19, when the S&P 500 fell 20.5% in one day. Our Black Monday 1987 article covers the causes and how long the recovery took.
Educational simulation only. Historical data is shown for teaching purposes; past performance does not indicate future results. Simulated outcomes are hypothetical and ignore fees, spread, slippage and taxes. Real investing involves costs and emotions a simulation cannot reproduce. StockCram is not a broker-dealer, investment adviser, or financial institution.