What Happens to Stocks During Wars — 80 Years of Data

From WWII to Ukraine — how the stock market has reacted to every major military conflict, what recovered, what didn't, and what 80 years of S&P 500 data actually shows.

Sean Sha
By Sean Sha12 min read

Educational purposes only. This content does not constitute investment advice. Read our disclaimer

StockCram is not a broker-dealer, investment adviser, or financial institution. All content is for educational and informational purposes only and should not be construed as personalized investment advice. Consult a qualified financial professional before making investment decisions. Past performance does not guarantee future results.
What Happens to Stocks During Wars — 80 Years of Data
Share
12 min read

"Should I sell everything right now?" That's the question millions of investors ask every time a military conflict erupts — and with current US-Iran tensions leading headlines in 2026, it's being asked again. What happens to stocks during war? Does the stock market crash, or does it recover? We looked at 80 years of how bull and bear markets have played out historically to find out.

This guide covers how wars affect the stock market across every major U.S. military conflict from World War II to Russia-Ukraine — with actual S&P 500 drawdowns, recovery timelines, sector-by-sector data, and the historical pattern showing that stock market volatility during the buildup to war has often been worse than during the conflict itself. Updated April 2026.

This is the first post in a three-part series on geopolitical risk and markets. This post covers stock market performance during war across 80 years of data. Part 2 covers how wars affect oil prices and the Strait of Hormuz, and Part 3 examines why the current US-Iran conflict is structurally different. Historical data is presented for educational context — past performance does not indicate future results.

What Happens to the Stock Market During War?

In most cases, the stock market drops before war — but has historically recovered within 3 to 12 months after conflict begins.

Short answer: The stock market usually drops before a war starts — driven by uncertainty — but has historically recovered once the conflict begins. In 6 of 7 major military conflicts since 1941, the S&P 500 was higher 12 months after the conflict started. Here's the quick version before we dive into 80 years of data.

  • Stocks often fall before war due to uncertainty, not during the conflict itself
  • Stocks often recovered within 12 months of a conflict starting — the pattern held across most major wars
  • Defense and energy sectors have consistently outperformed, while airlines, travel, and consumer discretionary have lagged
  • Recovery to pre-conflict levels has typically taken 3 to 12 months — but overlapping crises (inflation, rate hikes) extend timelines significantly
  • Every conflict is unique. Historical patterns are observations, not predictions.

Key Takeaway: The historical record suggests markets are more sensitive to the uncertainty of whether conflict will happen than to the conflict itself — but every situation carries unique risks.

War and the Stock Market: Quick Answers

Common questions answered at a glance. Past performance does not indicate future results.

QuestionShort Answer
Do stocks go down during war?Usually before war (uncertainty phase), not always during
How long to recover?3–12 months historically for the war-specific drawdown
Which sectors tend to outperform?Defense (ITA, XAR) and energy (XLE)
Which sectors tend to underperform?Airlines (JETS), travel, consumer discretionary (XLY)
Biggest risk factor?When war overlaps with inflation or central bank tightening

Stock Market Performance During Wars: 80 Years of Historical Data

Here's what the data shows. The table below summarizes how the S&P 500 performed during every major U.S. military conflict since 1941. Each row shows the initial bear market drawdown, how long it took to bottom, how long it took to recover, and what happened 12 months after the conflict started. The pattern is surprisingly consistent — but the exceptions matter just as much as the rule.

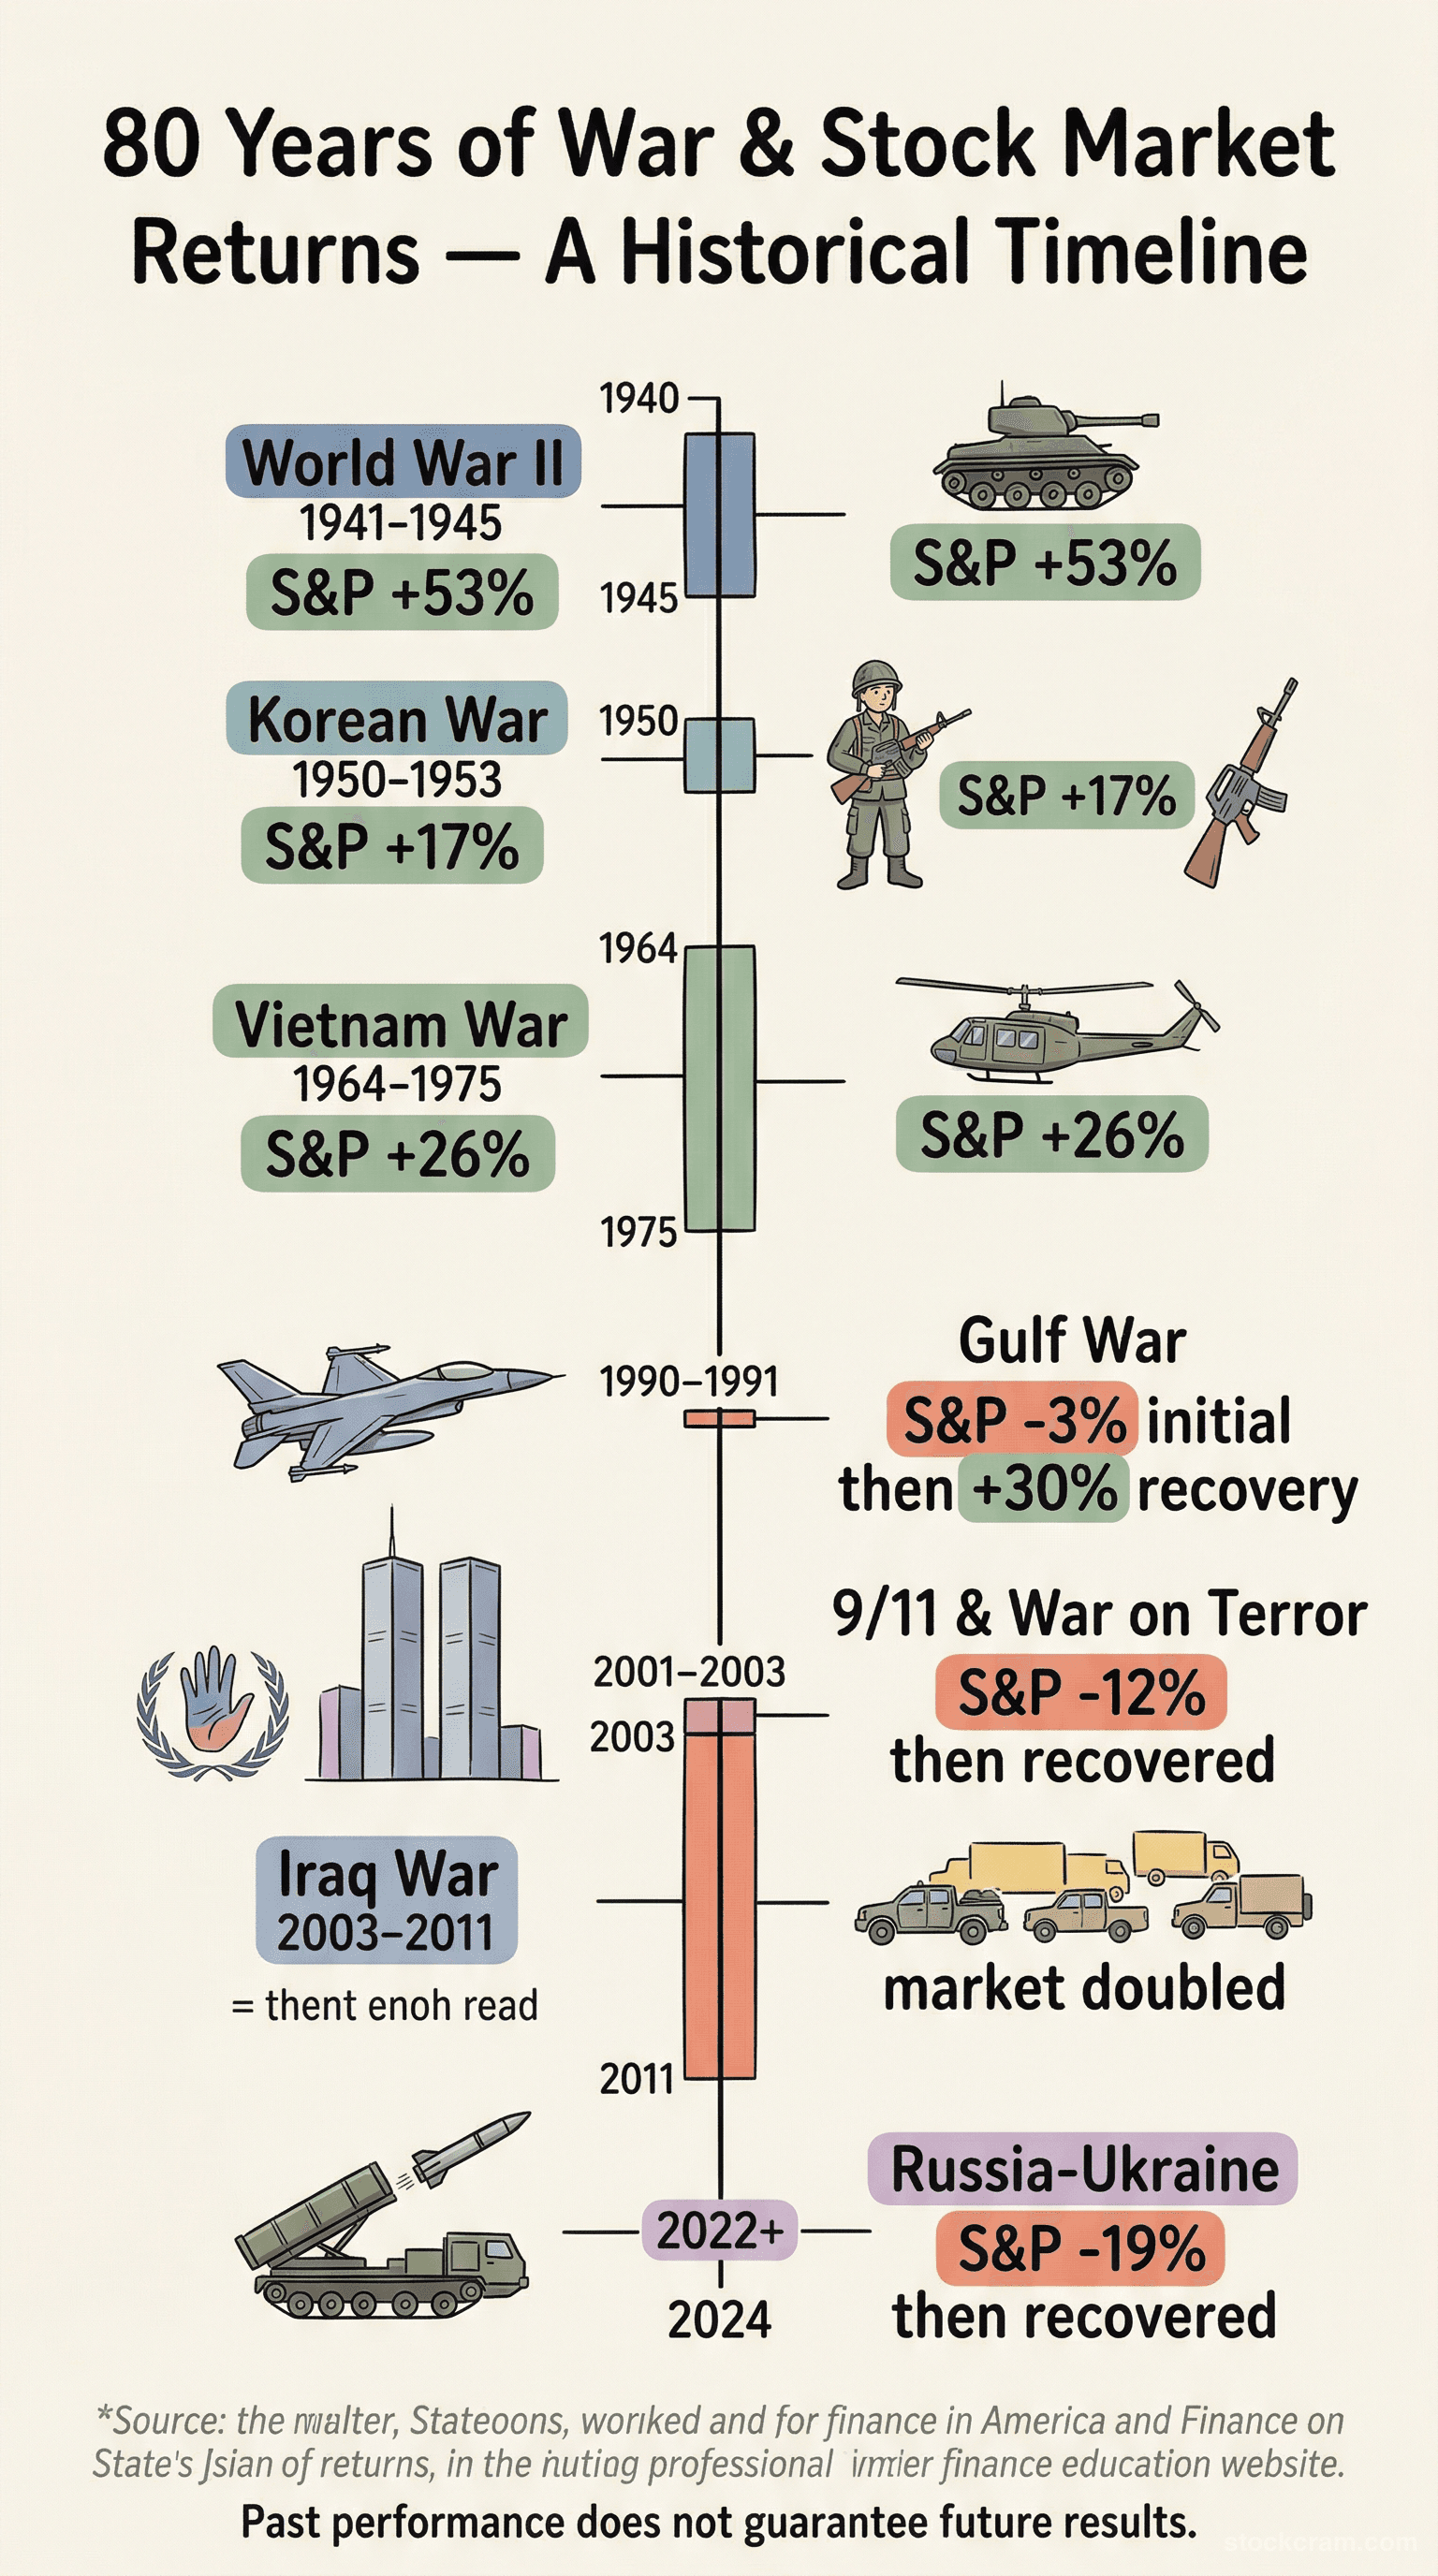
The timeline below visualizes how the S&P 500 responded to each conflict — from the initial drawdown to recovery.

  • The S&P 500 posted a positive 12-month return after most conflicts on this list — the sole exception coincided with the dot-com bust
  • The sole exception was 9/11, which coincided with the already-in-progress dot-com bust — the war amplified an existing downturn
  • Initial drawdowns ranged from -4.9% (Vietnam) to -19.9% (Gulf War)
  • Recovery times averaged 3 to 10 months, depending on the severity of the initial shock

Key Takeaway: In 6 of 7 major military conflicts since 1941, the S&P 500 was higher 12 months after the conflict began — though the path to recovery was rarely smooth.

S&P 500 performance during 7 major wars from 1941 to 2024 — 80-year historical timeline showing drawdowns and recoveries
Figure: Historical timeline of S&P 500 performance during major military conflicts. In 6 of 7 wars, the market was higher 12 months later. Past performance does not guarantee future results.
S&P 500 Performance During Major Military Conflicts (1941–2022)

Historical data shown for educational context. Past performance does not indicate future results.

DatesConflictRecovery TimeDays To Bottom12 Month ReturnInitial Drawdown
1941–1945World War II~10 months143+15.5%-19.8%
1950–1953Korean War~3 months22+28.8%-14.0%
1964–1975Vietnam War~2 months34+10.2%-4.9%
1990–1991Gulf War~4 months71+23.6%-19.9%
2001–20219/11 & Afghanistan~3 months11-16.8%-11.6%
2003–2011Iraq Invasion~2 months120+30.1%-12.0%
2022–presentRussia-Ukraine~1 month5+2.5%-5.3%
War and the Stock Market: Typical Pattern by Phase

Generalized pattern observed across major U.S. conflicts. Individual wars may deviate. Past performance does not indicate future results.

PhaseTypical DurationTypical Market Reaction
Pre-war buildup (months before)1–6 monthsMarkets decline as uncertainty rises
Conflict beginsDays to weeksVolatility spikes, then markets often stabilize
3–12 months into conflict3–12 monthsMarkets have historically recovered to pre-conflict levels
Sector rotationDuration of conflictDefense and energy outperform; travel and consumer discretionary lag
Overlapping crisis (inflation, rate hikes)12+ monthsRecovery extends significantly beyond the war-specific impact

Why the Stock Market Drops Before War, Not During It

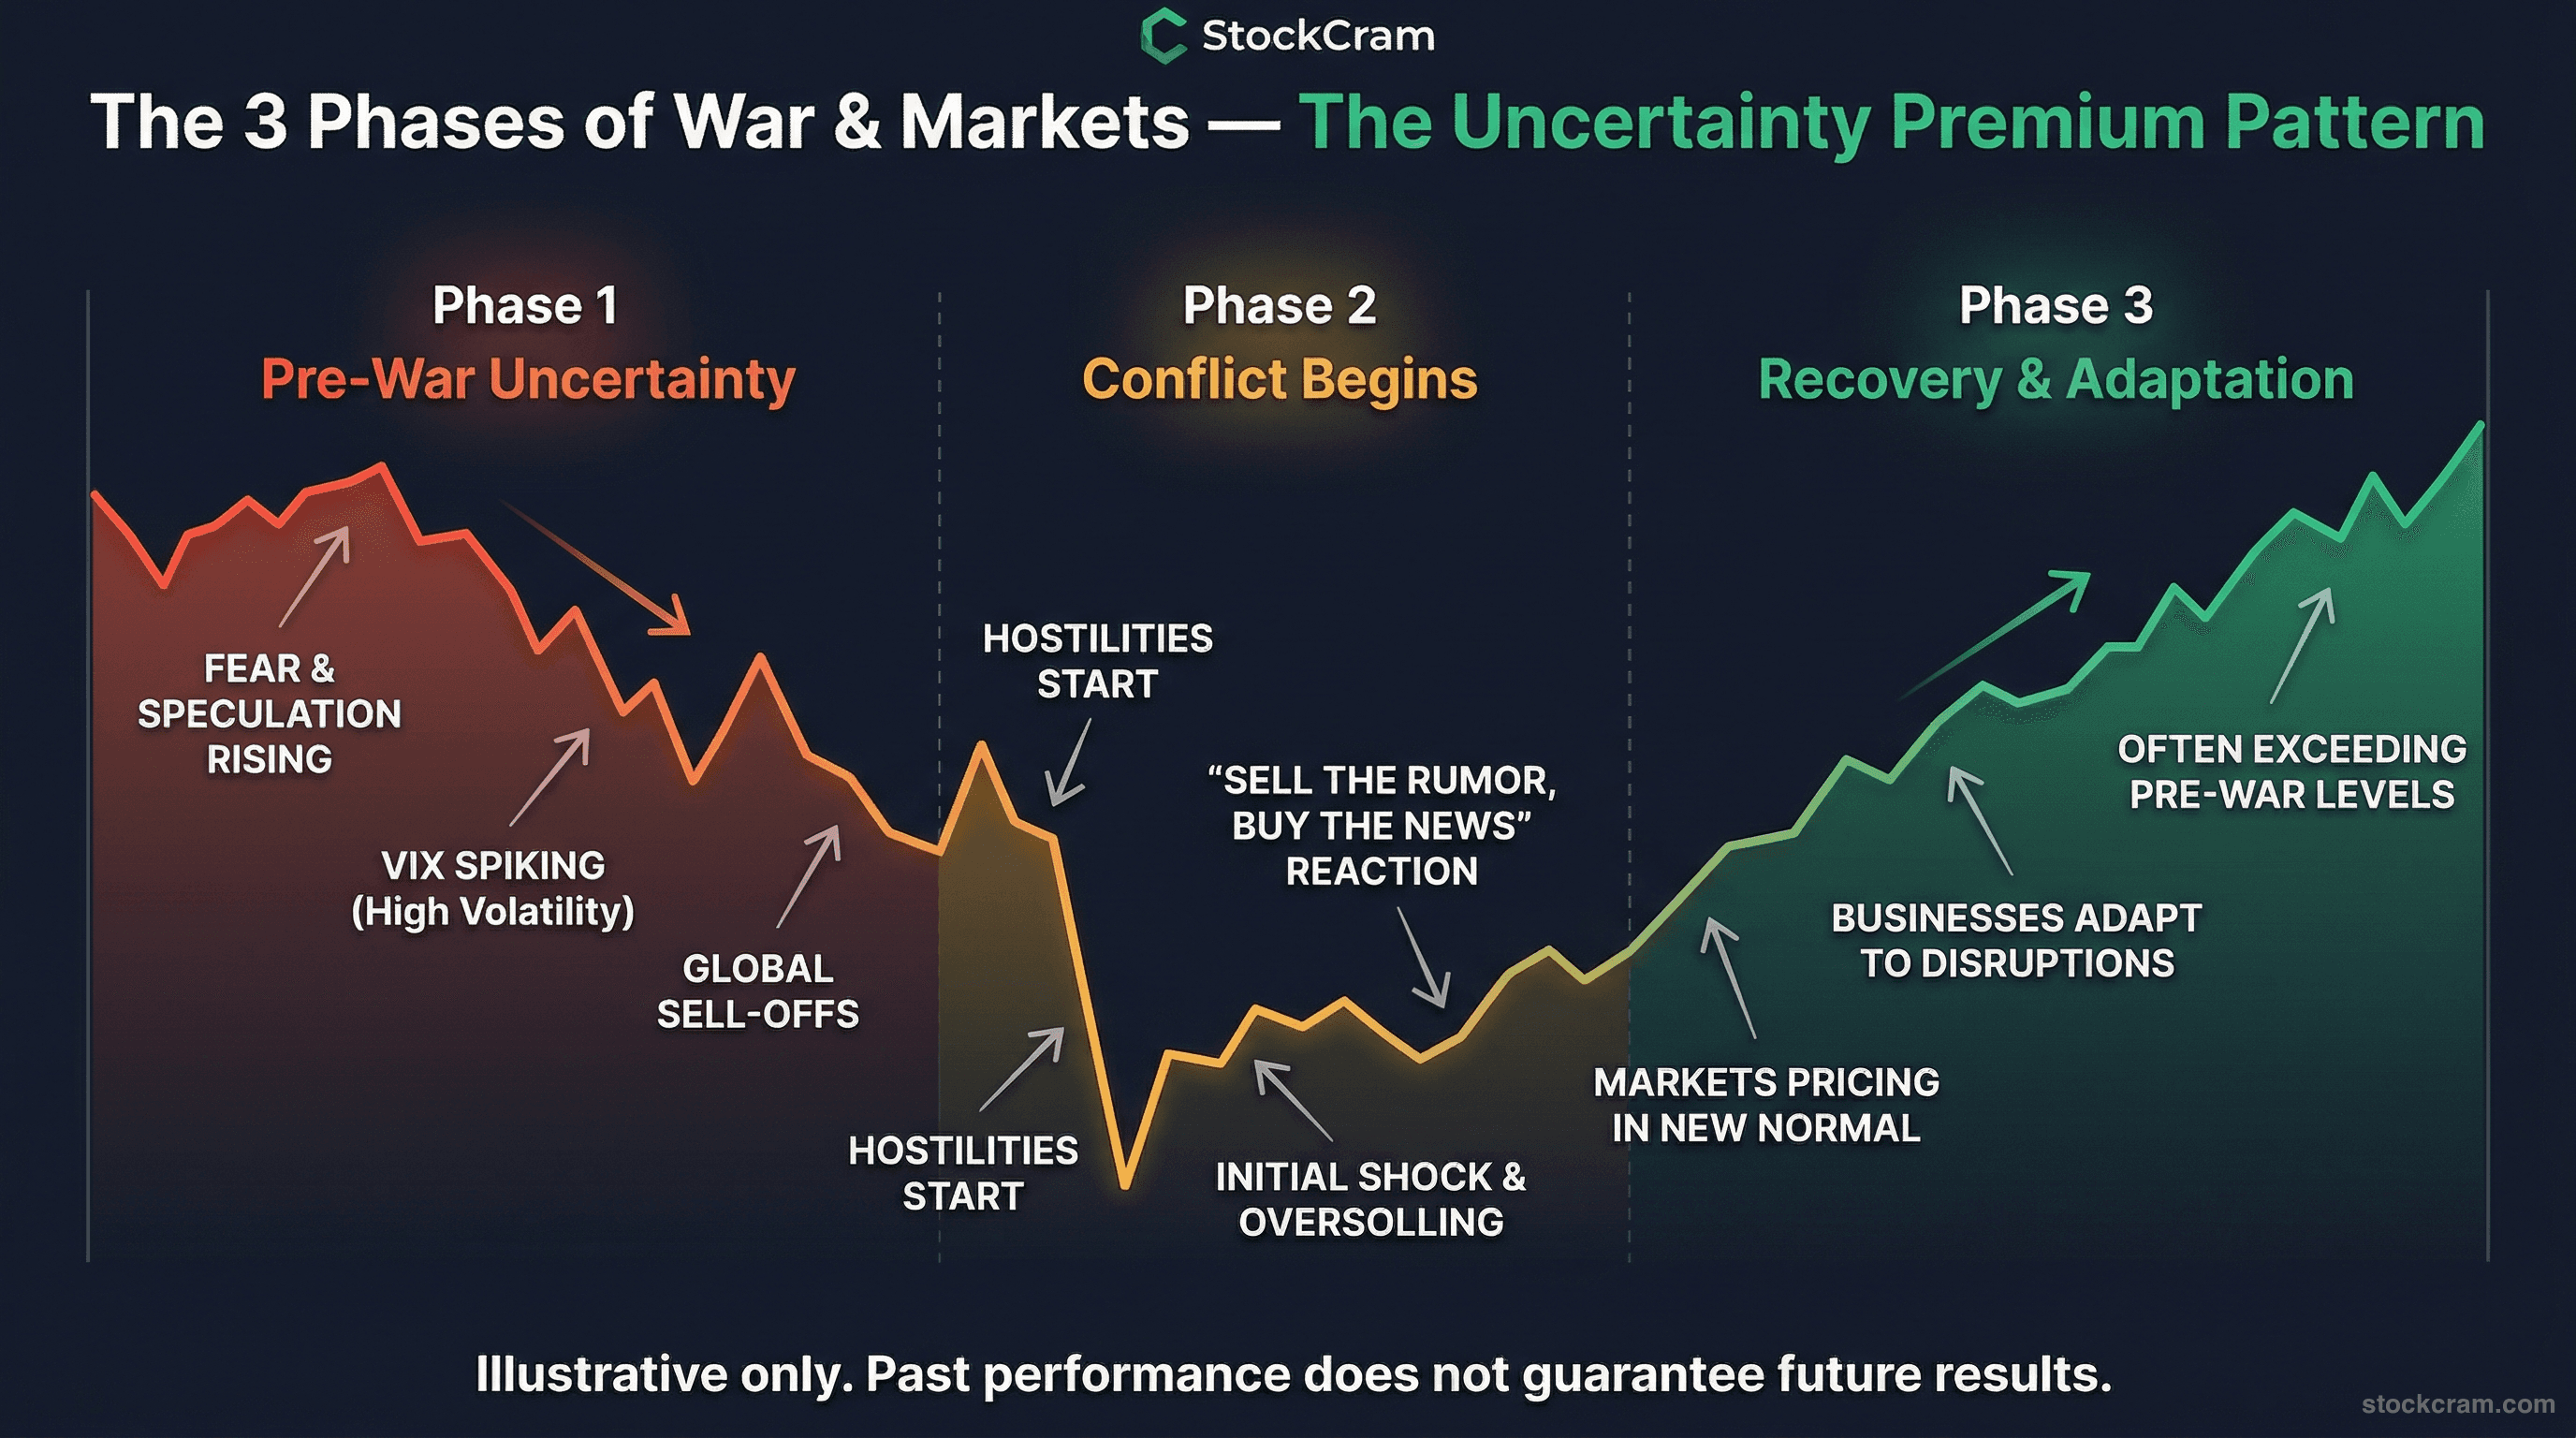
Here's the most counterintuitive finding in the data: markets have historically performed worse during the months before a military conflict begins than during the conflict itself. Financial historians call this the 'uncertainty premium' — the added market volatility that comes from not knowing whether, when, or how a conflict will unfold. Once military action begins, a major source of uncertainty resolves, and markets tend to stabilize. This pattern has been documented across multiple conflicts and is sometimes referred to as 'buy the invasion' in financial literature. To be clear: this is a historical observation about aggregate market behavior, not a trading strategy or recommendation. Markets can and do behave differently in individual cases.

The diagram below illustrates this three-phase pattern across major conflicts.

Real World Example

Setup: In the months leading up to the Iraq invasion (March 2003), markets were caught between two fears: the uncertainty of whether the U.S. would invade, and the economic drag of the post-dot-com recession.

Action: The S&P 500 dropped approximately 12% between late 2002 and March 2003 as uncertainty peaked. Then, on March 20, 2003, the invasion began.

Possible Outcomes:

The uncertainty phase: Markets fell steadily as investors couldn't price the timing, scope, or outcome of a potential invasion

Anxiety and risk aversion drove selling

Once the invasion started: The S&P 500 rallied approximately 30% over the following 12 months as the major unknown was resolved

Clarity, even negative clarity, is easier for markets to process than open-ended uncertainty

Key Takeaway: Historically, markets have tended to bottom around the onset of military action — the uncertainty of whether conflict will happen has often been more damaging to markets than the conflict itself. This is a historical pattern, not a prediction or strategy.

The 3 phases of how stock markets react to war — pre-war decline, conflict stabilization, and post-war recovery pattern
Figure: The typical three-phase pattern of how stock markets respond to military conflict — fear before, volatility during, recovery after. Past performance does not guarantee future results.
The Uncertainty Premium: Market Performance Before, During, and After Conflict

S&P 500 returns across three phases of major conflicts. Past performance does not indicate future results.

ConflictFirst 30 DaysSix Months Pre ConflictTwelve Months Post Start
Gulf War (1990)+10.3%-16.9%+23.6%
Iraq Invasion (2003)+8.2%-12.0%+30.1%
Russia-Ukraine (2022)+5.8%-8.7%+2.5%

World War II (1941–1945): The Longest War, the Biggest Rally

World War II is the extreme case — the most devastating conflict in human history, and paradoxically, a period of substantial stock market gains. After the attack on Pearl Harbor on December 7, 1941, the Dow Jones Industrial Average fell approximately 7% over two trading days. The broader market continued declining, bottoming in April 1942 at roughly 20% below pre-Pearl Harbor levels. Then something remarkable happened. From its 1942 bottom to Victory over Japan Day in August 1945, the market roughly doubled. The explanation has nothing to do with optimism about war. It's economics: wartime manufacturing created a boom in GDP, unemployment effectively vanished as millions entered the military and factories, government spending surged, and — crucially — consumer spending was suppressed by rationing, meaning corporate earnings had few places to go but into retained earnings and capacity expansion. The WWII case established a pattern that would repeat: markets drop sharply on the initial shock, then recover as the economic machinery of war stimulates production, spending, and employment.

  • Pearl Harbor shock: Dow fell ~7% in 2 days, broader market dropped ~20% by April 1942
  • From the 1942 bottom to VJ Day (1945), the market roughly doubled
  • Wartime economy: full employment, massive government spending, industrial production surge
  • Consumer rationing suppressed spending, channeling capital into production and corporate earnings

Real World Example

Setup: The U.S. wartime economy transformed the industrial base almost overnight

Action: Auto factories switched to producing tanks and aircraft. Consumer goods were rationed. Unemployment fell below 2%.

Possible Outcomes:

Economic output: U.S. GDP roughly doubled between 1940 and 1945, from approximately $100 billion to $228 billion

The economic boom was real even as the human cost was catastrophic

Stock market reaction: After the initial shock, stocks rose steadily as investors recognized that wartime spending was enormously stimulative

Markets followed the money — government contracts meant reliable revenue for industrial companies

Key Takeaway: The S&P 500 roughly doubled from its 1942 wartime bottom to VJ Day in 1945 — wartime government spending drove an economic boom even as the human cost was catastrophic.

Korea and Vietnam: The Cold War Era

The Korean and Vietnam Wars illustrate an important distinction: short, decisive conflicts produce cleaner market patterns, while prolonged wars get entangled with other economic forces. The Korean War (1950–53) was sharp and relatively quick in market terms. When North Korea invaded South Korea in June 1950, the S&P 500 dropped approximately 14% in three weeks — a rapid, fear-driven selloff. But the recovery was equally swift: within three months, the market was back to pre-war levels, and by the end of the conflict period, the S&P 500 was up roughly 40%. The economic logic was similar to WWII: military spending boosted industrial production and employment. Vietnam (1964–75) tells a messier story. The market initially rose during the early escalation phase (the Gulf of Tonkin Resolution in 1964), and the initial military commitment didn't cause significant market disruption. The drawdown was modest — about 5%. But as the war dragged on through the late 1960s and early 1970s, the market struggled. Not because of Vietnam specifically, but because the war coincided with rising inflation, the end of the gold standard (Nixon Shock, 1971), the 1973 oil embargo, and social upheaval. By the mid-1970s, it was impossible to separate Vietnam's market impact from these overlapping economic crises. This is the first major lesson about long wars: the longer a conflict lasts, the more it becomes entangled with other economic forces, making the 'war impact' nearly impossible to isolate.

  • Korea: sharp -14% drawdown, recovered in 3 months, ended conflict period up ~40%
  • Vietnam: modest -4.9% initial drawdown, but market struggled in late 1960s–70s
  • Vietnam's market pain was driven more by inflation, gold standard collapse, and oil embargo than the war itself
  • Key distinction: short, decisive conflicts produce clean market patterns; prolonged conflicts don't

Real World Example

Setup: The Korean War's market response was one of the cleanest examples of the 'shock and recover' pattern

Action: The S&P 500 plunged 14% in just 22 trading days after the June 1950 invasion, as investors priced in the worst-case scenario of Soviet expansion.

Possible Outcomes:

Short-term panic: 14% drawdown in less than a month — one of the fastest war-related selloffs in history

Genuine fear of a broader conflict with the Soviet Union

Rapid recovery: Markets recovered within 3 months and were up 28.8% twelve months after the conflict began

Once the conflict's scope became clear, the economic stimulus effect dominated

Key Takeaway: Short, decisive conflicts produce cleaner market patterns, while prolonged wars get entangled with inflation, policy changes, and social upheaval — separating the war impact from everything else becomes almost impossible.

The Gulf War (1990–91): How the Stock Market Reacted to Oil Shock

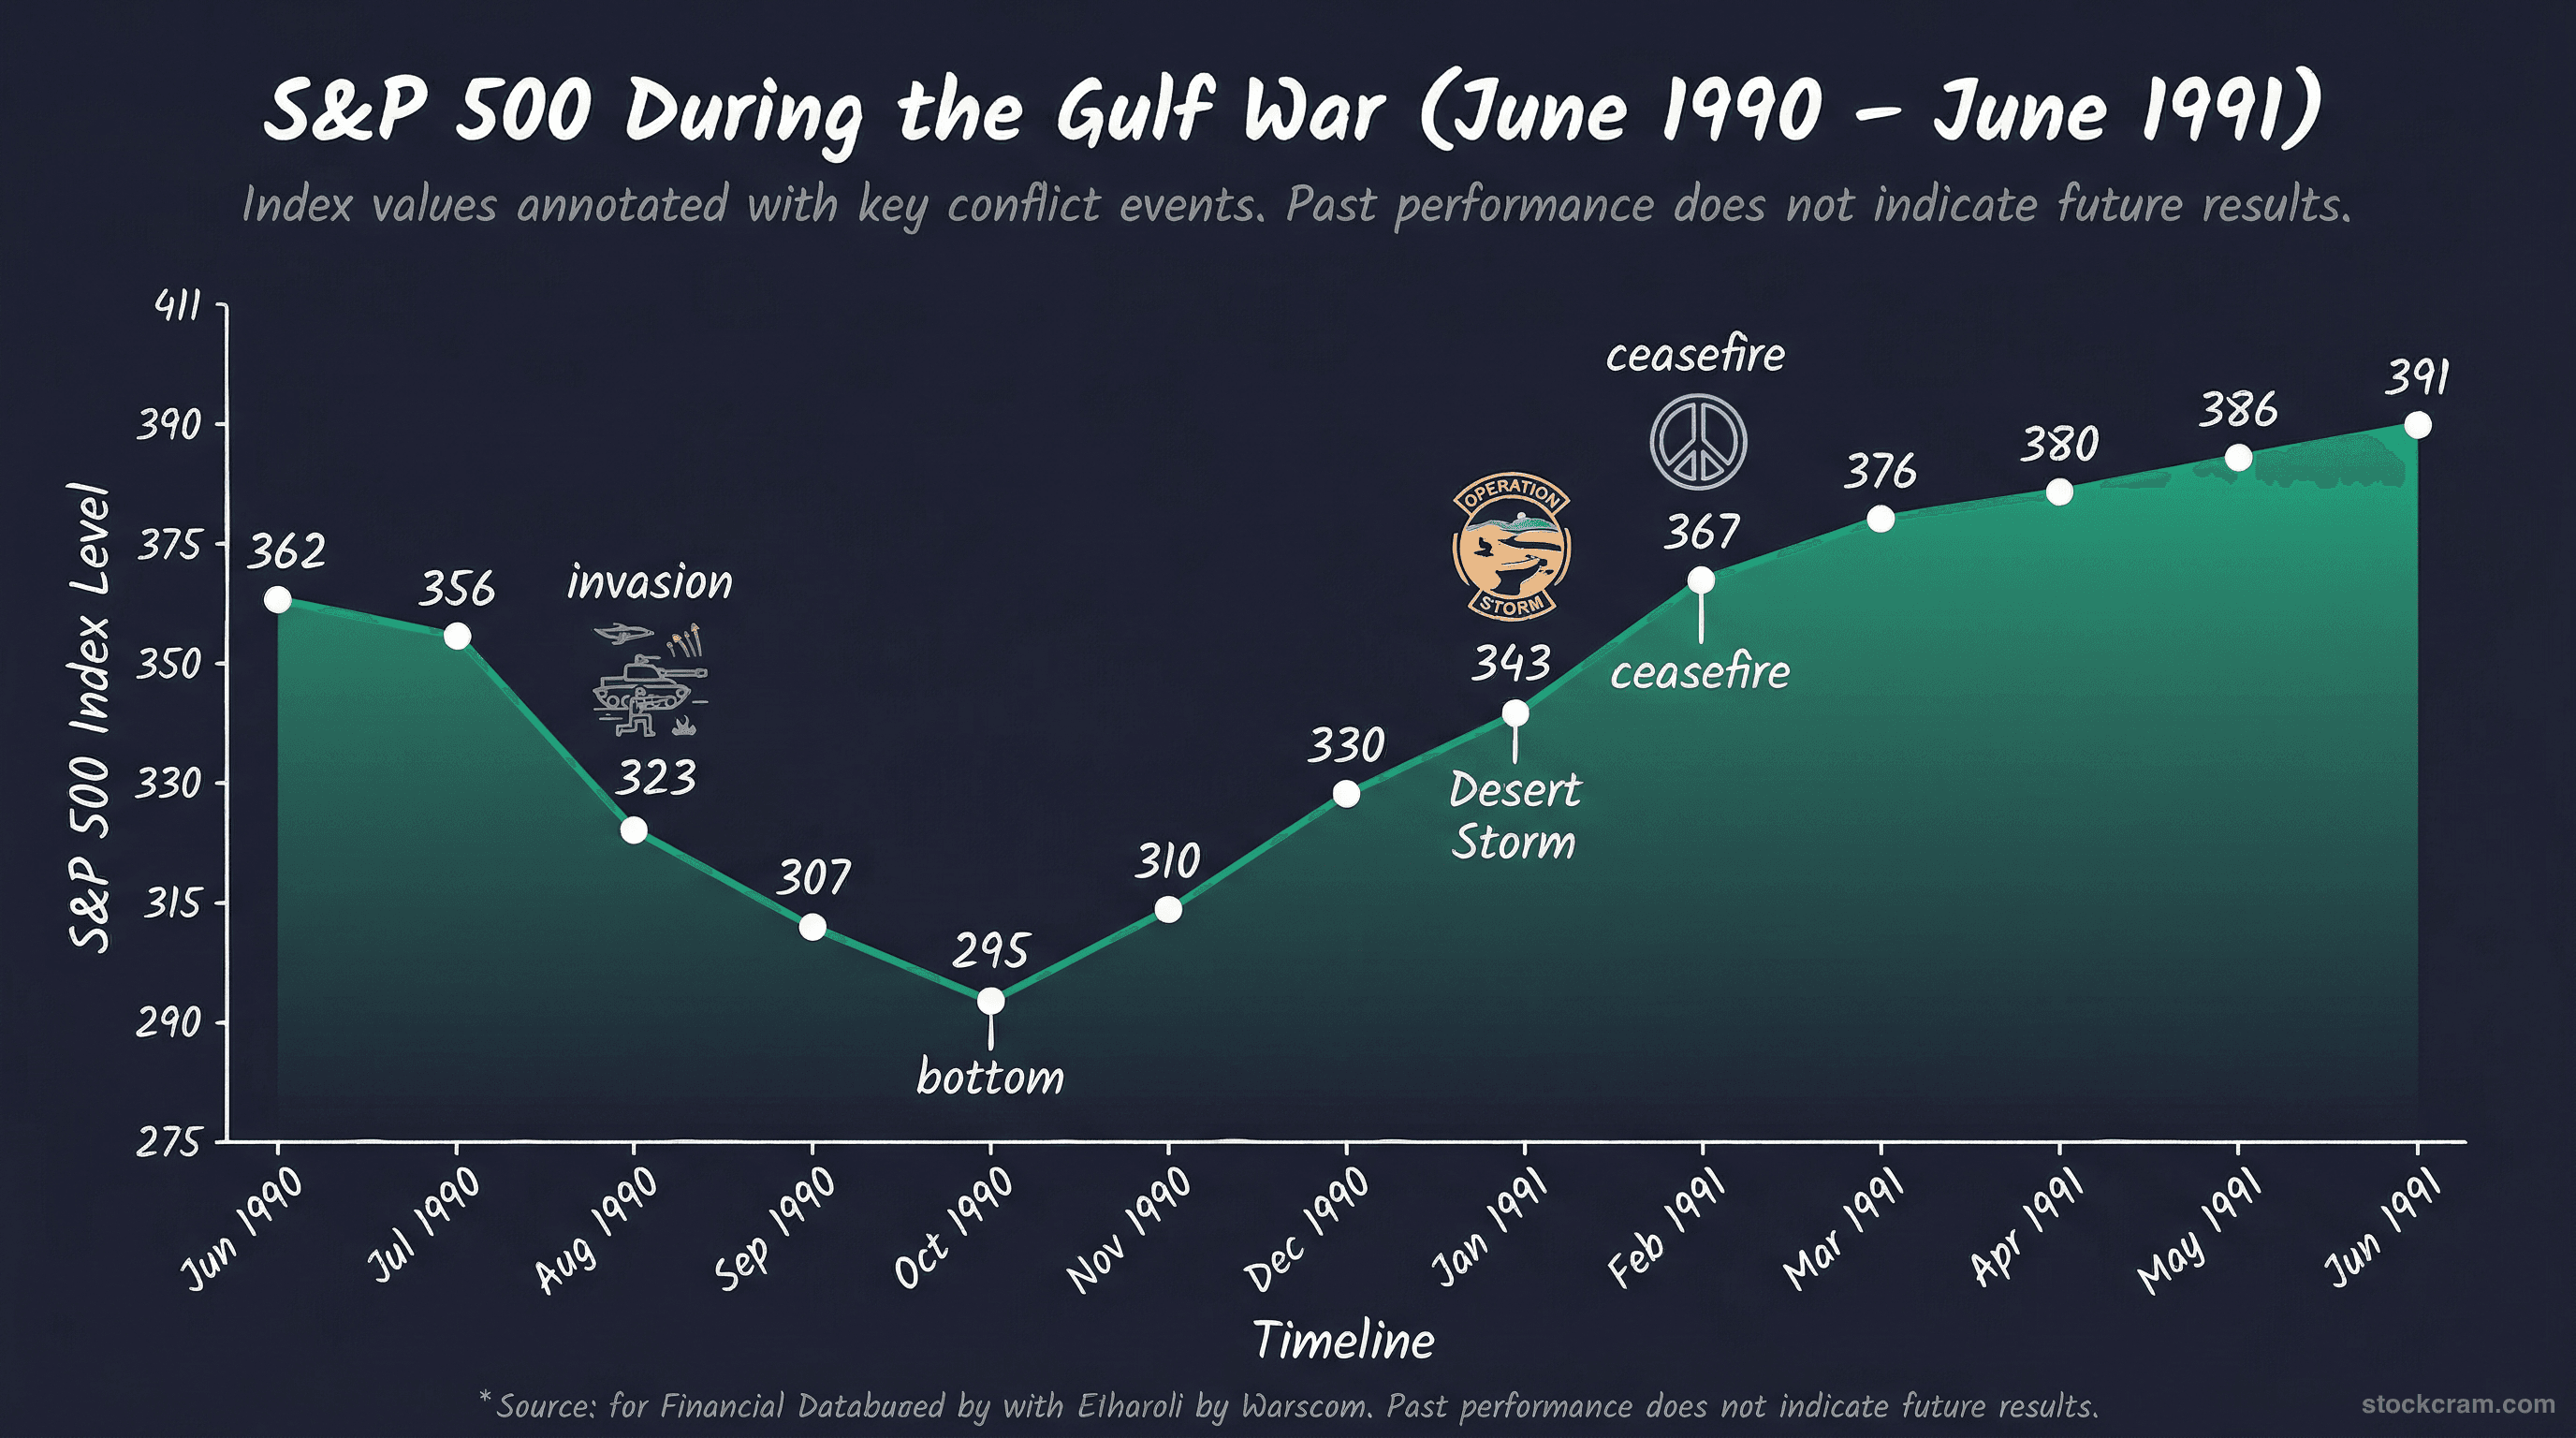
The Gulf War is the conflict most relevant to understanding the current Iran situation. It was the first major post-Cold War military conflict, it centered on oil-producing regions, and it produced the cleanest modern example of the uncertainty-resolution pattern. When Iraq invaded Kuwait on August 2, 1990, two things happened simultaneously: the S&P 500 began a steep decline that would reach -19.9% by October, and oil prices doubled from $21 to $41 per barrel in a matter of weeks. The invasion threatened approximately 9% of global oil production and raised fears that Saddam Hussein might push into Saudi Arabia, which would have disrupted an additional 15% of global supply. For the next five months, markets ground lower as the question hung in the air: would there be a full-scale war? When Operation Desert Storm began on January 17, 1991, the answer came — and so did the rally. The S&P 500 surged over 10% in the first 30 days of the air campaign. Oil prices collapsed back toward pre-invasion levels within weeks. The Gulf War established a template that energy analysts and geopolitical strategists still reference today: oil-driven conflicts in the Middle East follow a pattern of price spike on disruption fear, followed by rapid normalization once the disruption either happens (and is smaller than feared) or is resolved. For a deeper analysis of how oil prices respond to military conflicts and the strategic importance of the Strait of Hormuz, see Part 2 of this series on oil prices and the Strait of Hormuz.

The chart below shows the S&P 500 price action during this period. For context on how bear market drawdowns are measured, see our terminology guide.

  • S&P 500 fell 19.9% from July to October 1990 — the deepest war-related drawdown since WWII
  • Oil prices doubled from $21 to $41/barrel as 9% of global production was threatened
  • Operation Desert Storm (Jan 1991): S&P 500 surged 10%+ in the first month of the air campaign
  • Oil prices collapsed back to pre-invasion levels within weeks of the war starting
  • The Gulf War established the template for oil-driven geopolitical market impacts

Real World Example

Setup: When Iraq invaded Kuwait in August 1990, global oil markets went into immediate shock

Action: Oil prices doubled from $21 to $41 per barrel in just weeks. Airlines saw jet fuel costs spike overnight. Shipping and logistics companies faced surging transportation costs. The U.S. economy, far more oil-dependent in 1990 than today, tipped into recession partly driven by the energy price shock.

Possible Outcomes:

Energy companies: ExxonMobil and other major oil producers saw revenue surge as the higher oil price flowed directly to their bottom line

Energy investors benefited from the supply disruption premium

Airlines and transportation: Airlines were hit from both sides — fuel costs spiked and travel demand dropped as consumers and businesses pulled back

The double squeeze made airlines one of the worst-performing sectors during the Gulf War period

Key Takeaway: The Gulf War is the clearest example of the uncertainty-resolution pattern — markets dropped 19.9% on uncertainty, oil doubled, then both reversed sharply once military action began and the outcome became clearer.

S&P 500 performance during the Gulf War 1990-1991 — 19.9% drawdown and recovery after Operation Desert Storm
Figure: The S&P 500 dropped 19.9% during the Gulf War uncertainty phase, then recovered fully within months of Operation Desert Storm. Past performance does not indicate future results.

September 11 and Afghanistan (2001): Stock Market Crash and Recovery

September 11, 2001, broke the pattern in one critical way: there was no buildup phase. Every other conflict on this list featured weeks or months of escalating tension before military action. The attacks on 9/11 were a complete surprise — no uncertainty premium, just shock. The New York Stock Exchange closed for four consecutive trading days, the longest shutdown since 1933. When markets reopened on September 17, the Dow Jones fell 7.1% in a single day and continued falling, losing 14.3% in the first five trading days. In total, the S&P 500 dropped 11.6% from its pre-9/11 close. But context matters enormously here. The market was already deep in a bear market caused by the dot-com bust. The S&P 500 had already fallen over 25% from its March 2000 peak before the attacks. September 11 accelerated an existing decline — it didn't create one. The recovery from the 9/11 shock specifically (not the broader bear market) was remarkably fast. The S&P 500 returned to its September 10 closing level by early November 2001 — roughly two months. The Afghanistan invasion on October 7, 2001, barely registered as a market event because investors had already processed the shock and were focused on economic fundamentals.

  • NYSE closed 4 trading days — longest shutdown since 1933
  • S&P 500 dropped 11.6% in the first week of trading after reopening
  • Critical context: the market was already in a bear market from the dot-com bust (down 25%+ from 2000 peak)
  • Recovery to pre-9/11 levels took only ~2 months, but the broader bear market continued
  • The 12-month return was -16.8% — but that reflected the dot-com recession, not primarily the military response

Real World Example

Setup: The 9/11 attacks created a unique market scenario: a pure shock event with no prior buildup or uncertainty premium

Action: With no chance to gradually price in risk, the market absorbed the entire shock in a single compressed event — the 4-day closure followed by one of the worst trading weeks in history.

Possible Outcomes:

The shock absorption: Markets priced in the worst in 5 trading days, then began recovering almost immediately

The initial response was [fear-driven](/learn/start-investing/overcoming-fear) selling, then rational reassessment

The separation effect: The 9/11-specific shock recovered in 2 months. The broader bear market (dot-com bust + recession) took until 2003.

Investors distinguished between the geopolitical shock and the underlying economic problems

Key Takeaway: Even an unprecedented shock attack with no warning saw markets recover to pre-attack levels within months, though the broader dot-com bear market continued on its own trajectory — context matters more than the headline.

9/11 Market Impact Timeline

Day-by-day market response to the September 11 attacks. The broader dot-com bear market continued on its own trajectory.

EventSp500Change
Sep 10 (pre-attack close)1,092
Sep 11–14 (market closed)Closed4-day shutdown
Sep 17 (reopening day)1,039-4.9%
Sep 21 (first week)966-11.6%
Oct 7 (Afghanistan invasion)1,073-1.7% from pre-9/11
Nov 5 (2 months)1,100+0.7% from pre-9/11
Sep 10, 2002 (1 year)909-16.8% from pre-9/11

Iraq Invasion (2003): Stock Market Performance During the War

If you could only study one historical example of how markets respond to military conflict, the Iraq invasion of 2003 would be the one. It's the cleanest modern example of the uncertainty premium at work. For months leading up to March 2003, the debate dominated headlines: would the U.S. invade Iraq? UN weapons inspections, diplomatic maneuvering, and troop buildups created a sustained period of uncertainty that weighed heavily on markets. The S&P 500 dropped approximately 12% between November 2002 and its March 2003 bottom. Then, on March 20, 2003, the invasion began. The uncertainty was over. Whatever came next — and plenty of it would be bad — the question of 'will they or won't they' was answered. Markets responded immediately. The S&P 500 rallied approximately 30% over the following 12 months. Oil, which had spiked to $37/barrel in the buildup, settled back to the $25–30 range within weeks. Defense contractors saw the beginning of a multi-year outperformance cycle as government defense spending surged. The Iraq case also illustrates a subtlety: the rally wasn't because the war was 'good for the economy.' It was because the removal of uncertainty allowed investors to price risk more accurately. Markets can handle bad news — it's the unknown they struggle with.

  • S&P 500 dropped ~12% during the months-long buildup (Nov 2002 – Mar 2003)
  • Once the invasion began (March 20, 2003), the market immediately started rallying
  • 12-month return from invasion start: approximately +30%
  • Oil spiked to $37 pre-invasion, settled back to $25–30 range within weeks
  • The rally was about uncertainty resolution, not the war being 'good' for the economy

Real World Example

Setup: The 5-month buildup to the Iraq invasion was a masterclass in how uncertainty damages markets

Action: Every UN vote, every inspector's report, every diplomatic meeting moved markets — not because the outcome mattered as much as the fact that the outcome remained unknown.

Possible Outcomes:

Before March 20: Markets declined steadily as the probability of invasion oscillated between 50% and 95% — never certain, always anxious

The market was paralyzed by the inability to price a binary outcome

After March 20: Even though the invasion meant combat, casualties, and massive government spending, markets rallied because the binary uncertainty was resolved

Relief — not about the war, but about the ability to finally calculate forward-looking risk

Key Takeaway: The Iraq invasion is the clearest modern example of the uncertainty premium pattern — the S&P 500 rallied approximately 30% in the 12 months following the start of military action, not because war is good for markets, but because the end of uncertainty is.

Russia-Ukraine (2022): Modern Geopolitical Risk

The Russian invasion of Ukraine on February 24, 2022, is the most recent large-scale military conflict and the closest analog to a modern, interconnected global economy responding to geopolitical shock. The initial market reaction was relatively contained: the S&P 500 fell approximately 5.3% in two days. But like 9/11, the war landed on a market already under stress — the Federal Reserve was beginning an aggressive rate-hiking cycle to combat post-COVID inflation, and the S&P 500 had already declined from its January 2022 highs. The war-specific market impact was sharpest in Europe, where energy dependence on Russian gas created a genuine economic crisis. European natural gas prices surged over 300% during 2022, and the eurozone narrowly avoided recession. U.S. markets, while affected, were more insulated due to domestic energy production. In the U.S., the sector story was clear. Energy stocks (tracked by XLE ETF) surged 58% in 2022 — the best-performing sector by a wide margin — as oil prices spiked to $130/barrel. Defense stocks also massively outperformed: Lockheed Martin (LMT) gained approximately 37%, RTX Corporation rose about 17%, and Northrop Grumman (NOC) climbed roughly 38% as NATO nations accelerated defense spending. Meanwhile, the broader S&P 500 fell 19.4% in 2022. The Russia-Ukraine case adds an important modern dimension: in an interconnected global economy, wars can trigger sustained inflation through energy prices and supply chain disruptions, extending market pain well beyond the initial shock. StockCram is not affiliated with, endorsed by, or sponsored by any brokerage mentioned on this page. Individual stock and ETF mentions are for educational context only.

  • S&P 500 initial drawdown was modest (-5.3%) but the broader 2022 decline reached -19.4%
  • Energy (XLE +58%) and defense stocks (LMT +37%, NOC +38%) dramatically outperformed
  • European markets hit harder than U.S. due to Russian gas dependence
  • Oil spiked to $130/barrel — highest since 2008 — before settling
  • The war contributed to sustained inflation that extended market pain through 2022

Real World Example

Setup: Lockheed Martin (LMT) entered 2022 trading around $355 per share, with steady but unspectacular growth typical of a mature defense contractor

Action: When Russia invaded Ukraine in February 2022, NATO nations announced massive increases in defense spending. Germany alone committed to a €100 billion special defense fund, reversing decades of military budget cuts.

Possible Outcomes:

Lockheed Martin: LMT rose from $355 to approximately $480 by year-end 2022 — a gain of roughly 37% — while the S&P 500 fell 19.4%

Investors priced in years of increased government contracts from NATO's rearmament

European energy crisis: European natural gas prices surged over 300%, pushing several countries to the brink of recession and forcing emergency energy policies across the EU

The energy dependence on Russia created a vulnerability that Middle East-focused conflicts don't replicate for Europe

Key Takeaway: Russia-Ukraine confirmed that defense and energy stocks outperform during conflicts, but also showed that modern wars can trigger sustained inflation and supply chain disruptions that extend market pain well beyond the initial shock.

2022 Sector Performance During Russia-Ukraine Conflict

U.S. sector returns in 2022 showing divergence during geopolitical conflict. Past performance does not indicate future results.

SectorVs Sp500Return 2022
Energy (XLE)Outperformed by ~78%+58.3%
Defense (ITA)Outperformed by ~28%+8.4%
Utilities (XLU)Outperformed by ~19%-0.6%
S&P 500 (SPY)Benchmark-19.4%
Technology (XLK)Underperformed by ~9%-28.2%
Consumer Disc. (XLY)Underperformed by ~18%-37.0%
Airlines (JETS)Underperformed by ~2%-21.3%

Which Stocks Go Up During War? Sector-by-Sector Breakdown

Across all seven conflicts, a clear sector rotation pattern emerges. Certain industries consistently benefit from military conflict — not because war is 'good' for them in any moral sense, but because the economic mechanics of war (increased government defense spending, energy supply disruptions, flight to safety) create predictable demand shifts. Understanding these patterns through the lens of sector rotation and diversification provides educational context for how markets process geopolitical events.

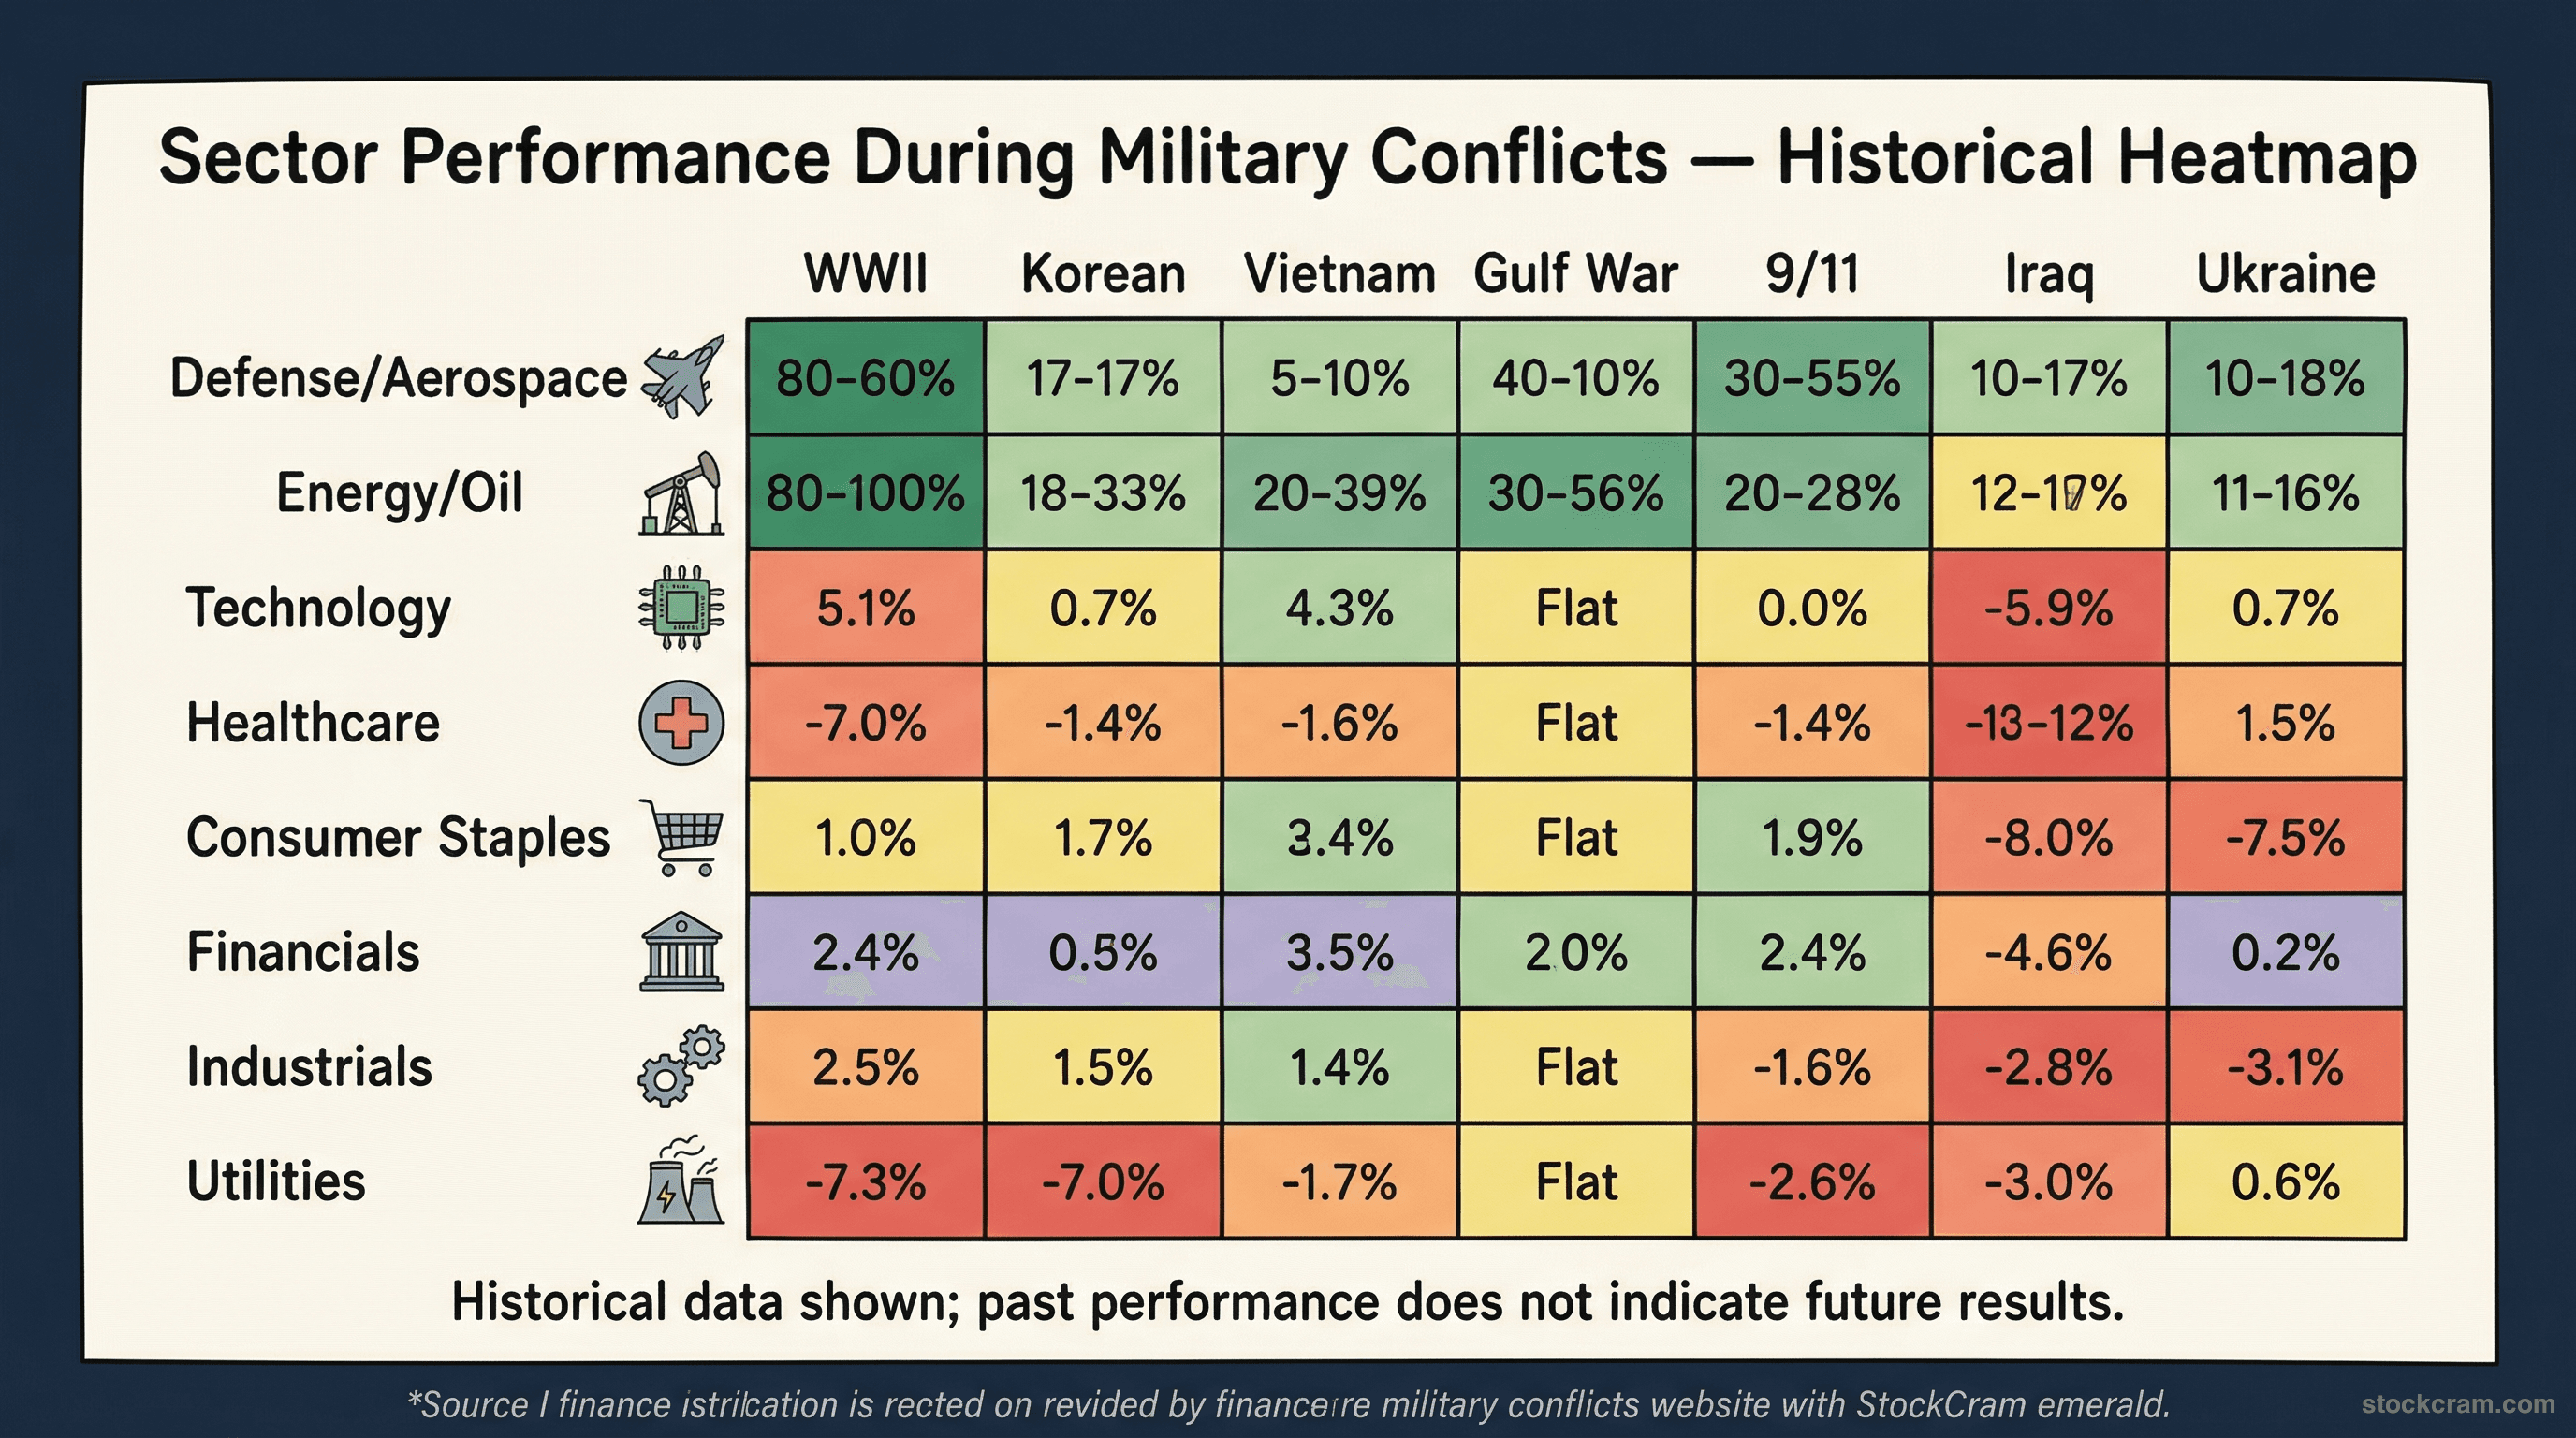
The heatmap below shows how each sector performed across all seven conflicts. Learn more about how ETFs track these sectors and how diversification can help manage sector-specific risk.

  • Defense and energy are the most consistent outperformers across all conflict types
  • Safe-haven assets (gold, treasuries) spike during the uncertainty phase but may normalize after
  • Consumer discretionary and travel consistently lag during military conflicts
  • Technology is a wildcard — modern cyber-enabled conflicts may benefit defense-tech companies differently than traditional wars
  • These are aggregate patterns. Individual conflicts always have unique sector dynamics.

Real World Example

Setup: Gold is often called the ultimate safe-haven asset, and its behavior during the Russia-Ukraine invasion illustrates the pattern clearly

Action: In the weeks surrounding the February 2022 invasion, gold prices surged from approximately $1,800 to over $2,050 per ounce — a gain of nearly 14% — as investors rushed into traditional safe havens.

Possible Outcomes:

The uncertainty spike: Gold hit its highest level since August 2020, driven by flight-to-safety buying. U.S. Treasury bonds also rallied initially.

Classic fear response: sell risky assets, buy safe-haven assets

The normalization: By mid-2022, gold had given back most of its gains as the Fed's rate hikes made cash and bonds more attractive alternatives. Gold ended 2022 roughly flat.

Safe-haven spikes tend to be temporary — they protect during the panic but often revert as the situation stabilizes

Key Takeaway: Defense and energy stocks have historically outperformed during military conflicts, while travel, consumer discretionary, and import-heavy sectors have consistently underperformed — though every conflict has unique dynamics.

Which stocks go up during war — sector performance heatmap showing defense and energy outperformance across 7 military conflicts
Figure: Defense and energy sectors have historically outperformed during every major military conflict since WWII, while airlines and consumer discretionary have underperformed. Past performance does not indicate future results.
Sector Performance During Military Conflicts: Historical Patterns

Aggregate patterns across 7 major U.S. military conflicts (1941–2022). Individual conflicts may deviate. Past performance does not indicate future results.

WhySectorEtf ExamplesStock ExamplesTypical Performance
Direct beneficiary of increased government defense spendingDefense / AerospaceITA, XARLMT, RTX, NOCOutperform
Supply disruption fears drive oil prices higherEnergy / Oil & GasXLE, OIH, VDEXOM, CVX, COPOutperform
Classic safe-haven asset during uncertaintyGold / Precious MetalsGLD, GDXNEM, GOLDOutperform
Flight to safety — investors move to [bonds](/learn/terms/bond)U.S. TreasuriesTLT, SHYOutperform (usually)
Depends on conflict type — cyber-era wars may benefit tech; traditional wars are neutralTechnologyXLK, QQQVariousMixed
Higher rates can help, but uncertainty in lending hurtsFinancialsXLFJPM, BACMixed
Consumer spending tightens during uncertaintyConsumer DiscretionaryXLYAMZN, NKEUnderperform
Higher fuel costs + reduced travel demandAirlines / TravelJETSDAL, UAL, AALUnderperform
Supply chain disruptions and higher input costsImport-Heavy RetailXRTWMT, TGTUnderperform

How Long Does the Stock Market Take to Recover After War?

The question investors ask most urgently during a conflict is: 'how long will this last?' The historical data provides a range, not a single answer. Across the seven major conflicts, the average time for the S&P 500 to recover to pre-conflict levels was approximately 6 to 12 months for the war-specific drawdown. But that average masks significant variation — and the most important variable isn't the war itself, it's what else is happening in the economy at the same time. When a military conflict is the primary source of market stress (Gulf War, Korea), recovery tends to be fast — 3 to 4 months. When conflict overlaps with other economic problems (inflation, Federal Reserve rate hikes, a bursting asset bubble), the recovery timeline stretches dramatically. Vietnam's market pain extended through the 1970s due to inflation and the oil embargo. The 2001 recovery from 9/11 was quick, but the broader dot-com bear market continued until 2003. Russia-Ukraine coincided with the worst inflation in 40 years and the most aggressive Fed tightening cycle since the early 1980s. One historical insight on dollar-cost averaging: investors who maintained regular monthly investments through each of the seven conflict periods — rather than stopping contributions during the drawdown — ended up with a lower average cost basis and better long-term returns than those who paused and waited for 'clarity.' This is a historical observation about the mathematics of averaging, not a recommendation for any individual's situation. For context on how monetary policy responses during crises affect recovery timelines, see our companion post on Fed independence. And for more on how currency dynamics shift during global uncertainty, see our dollar devaluation explainer.

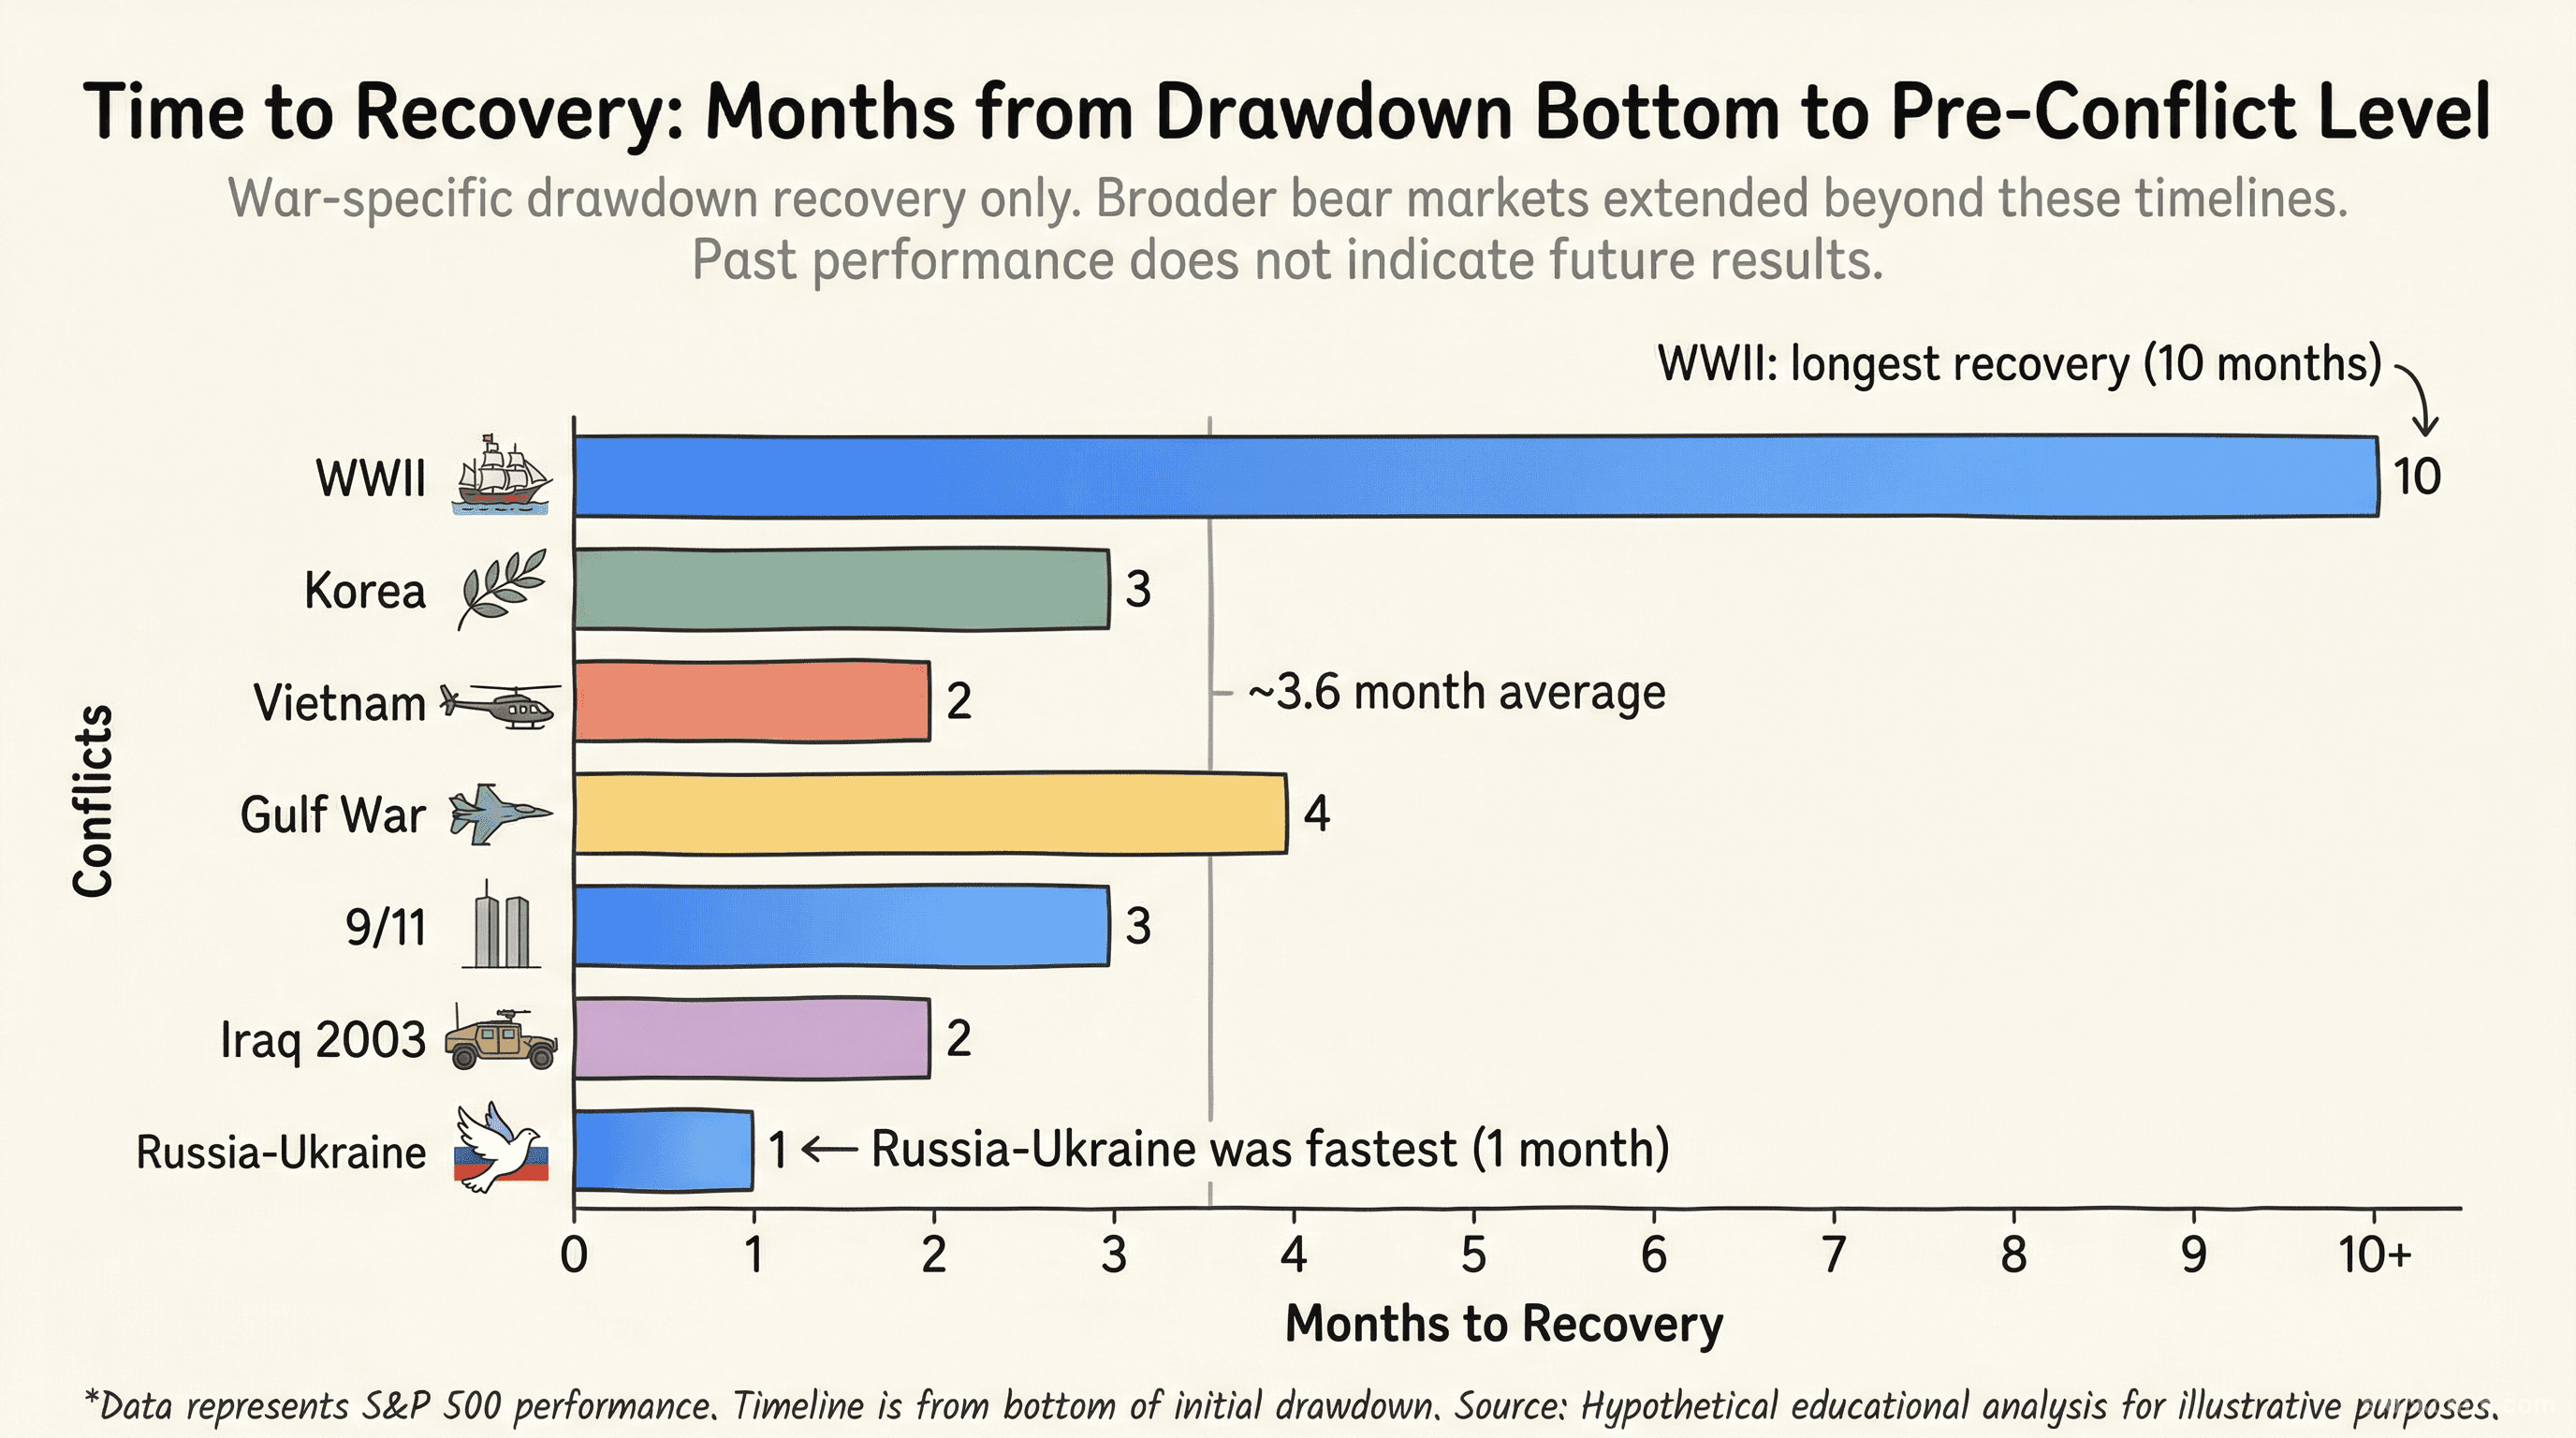
The chart below compares recovery timelines across all seven conflicts.

  • War-only drawdowns recovered in 1–10 months, with an average around 4 months
  • The fastest recoveries (1–3 months) occurred when the war was the primary stressor, not one of several
  • The slowest recoveries happened when conflict overlapped with inflation, rate hikes, or asset bubbles
  • Dollar-cost averaging through conflict periods has historically resulted in lower average cost bases
  • The Federal Reserve's response to conflict-driven economic stress has been a key factor in recovery speed

Real World Example

Setup: Consider a hypothetical investor who invested $500 per month into an S&P 500 index fund starting in January 1990, through the entire Gulf War period

Action: During the July–October 1990 drawdown (when the S&P 500 fell 19.9%), the monthly $500 investments bought more shares at lower prices. The investor who continued contributing through the panic acquired shares at a significantly lower average cost than the pre-war price.

Possible Outcomes:

Continued investing through the drawdown: By June 1991, those discounted shares purchased during the panic months were worth 20–30% more than what was paid for them, pulling the entire portfolio's average cost basis lower

Uncomfortable in real time, but mathematically advantageous in hindsight

Stopped investing during the drawdown: An investor who paused contributions from August to October 1990 missed buying at the lowest prices. Their average cost basis was higher, and their total shares owned were fewer.

Felt safer in the moment, but the math worked against them over the following 12 months

Key Takeaway: Most war-driven market drawdowns have historically recovered within 6–12 months, but conflicts that overlapped with broader economic problems (inflation, rate hikes) saw significantly longer recovery timelines — context matters as much as the conflict.

How long the stock market takes to recover after war — bar chart of recovery months across WWII, Korea, Vietnam, Gulf War, 9/11, Iraq, Ukraine
Figure: War-specific stock market drawdowns recovered in 1 to 10 months on average. Conflicts overlapping with inflation or rate hikes took significantly longer. Past performance does not indicate future results.

US-Iran 2026: How This Conflict Compares to Past Wars

The historical framework we've built across 80 years and seven conflicts provides context — but every conflict is unique. The current U.S.-Iran tensions have characteristics that differ meaningfully from past conflicts: the Strait of Hormuz carries roughly 20% of the world's oil supply through a narrow chokepoint, Iran has documented cyber warfare capabilities that can target financial infrastructure, the sanctions regime creates complex economic dynamics, U.S. energy production has changed dramatically since the shale revolution, and Iran's relationships with China and Russia create geopolitical dimensions that didn't exist during the Gulf War. These structural differences don't invalidate the historical patterns — markets still process uncertainty in broadly similar ways — but they do mean that a simple 'it'll follow the Gulf War playbook' assumption would be oversimplified. We explore these differences in depth in our companion posts: how wars affect oil prices and the Strait of Hormuz examines the energy supply dynamics, and why the US-Iran conflict is structurally different covers the full picture of how this conflict diverges from historical precedent. For additional context on how policy-driven market disruptions like tariff escalations create analogous uncertainty patterns, see our tariffs analysis. Historical data is educational context. Past performance does not indicate future results. Every investor's situation is unique.

  • The historical patterns (uncertainty premium, sector rotation, recovery timelines) provide a framework, not a prediction
  • The Iran situation has structural differences: Strait of Hormuz, cyber warfare, changed U.S. energy production, Iran-China-Russia dynamics
  • Simple analogies to past conflicts are incomplete — the differences are as instructive as the similarities
  • See Part 2 (oil/Strait of Hormuz) and Part 3 (what's different this time) for deeper analysis

Key Takeaway: While 80 years of data show consistent patterns, the current U.S.-Iran conflict has structural differences that make direct comparison complex — understanding both the patterns and the differences is essential for context.

Is War Good for the Stock Market?

This is one of the most searched questions about war and investing — and the answer is more nuanced than a simple yes or no. War is not 'good' for the stock market. The initial reaction to military conflict is almost always negative, with drawdowns ranging from 5% to 20% historically. But wars have often been followed by recoveries, driven by two forces: wartime government spending stimulates certain sectors (defense, energy, manufacturing), and the resolution of uncertainty allows markets to price risk more accurately.

  • Short-term: markets almost always decline — drawdowns of 5% to 20% are typical
  • Medium-term: recovery has historically occurred within 3 to 12 months in most cases
  • Long-term: the S&P 500 has grown through every major conflict since WWII
  • Some sectors benefit (defense, energy), many are harmed (airlines, retail, consumer discretionary)
  • The idea that 'war is good for stocks' oversimplifies a complex pattern — the reality depends on the conflict's duration, economic overlap, and policy response

Key Takeaway: War creates winners and losers across sectors, but the overall market trajectory depends heavily on whether the conflict is the primary stressor or one of several overlapping economic problems.

Frequently Asked Questions About Stocks During Wars

Common questions about how military conflicts have historically affected the stock market.

Key Takeaways

Markets fear uncertainty more than conflict

In most cases, the stock market drawdown occurs during the buildup to war, not during the conflict itself. Historically, markets have tended to bottom around the onset of military action as the major unknown is resolved.

6 of 7 major conflicts saw positive 12-month returns

From WWII to Russia-Ukraine, the S&P 500 was higher a year after the conflict began in all but one case (9/11, which coincided with the dot-com bust). Recovery timelines averaged 4 months for the war-specific drawdown.

Defense and energy sectors consistently outperform

Lockheed Martin, RTX, ExxonMobil, Chevron, and their respective ETFs (ITA, XAR, XLE) have historically outperformed during military conflicts, while airlines, travel, and consumer discretionary have lagged.

The Gulf War (1990) is the closest template for Iran

Oil-driven, Middle East-based conflict with direct energy supply implications. The market pattern — a 19.9% drop on uncertainty followed by rapid recovery after military action — established a template analysts still reference.

Overlapping crises complicate recovery

When war coincides with other economic problems (inflation, rate hikes, asset bubbles), the recovery timeline extends significantly. The war itself may resolve quickly, but the economic aftershocks can persist.

Enjoyed this article?

Share

Related Articles