
Dot-Com Bubble Burst: How Long Did It Take to Recover?
The Nasdaq fell 78% after March 2000 and took 15 years to regain its high. The S&P 500 fell 49%, was back by 2007, and has stayed above its 2000 record since 2013.
15 min read
Read Article
The Dow fell 89% after 1929 and took 25 years to regain its high by price. With dividends reinvested and deflation counted, the market was briefly back by 1936 and for good by 1949.

Educational purposes only. This content does not constitute investment advice. Read our disclaimer
StockCram is not a broker-dealer, investment adviser, or financial institution. All content is for educational and informational purposes only and should not be construed as personalized investment advice. Consult a qualified financial professional before making investment decisions. Past performance does not guarantee future results.
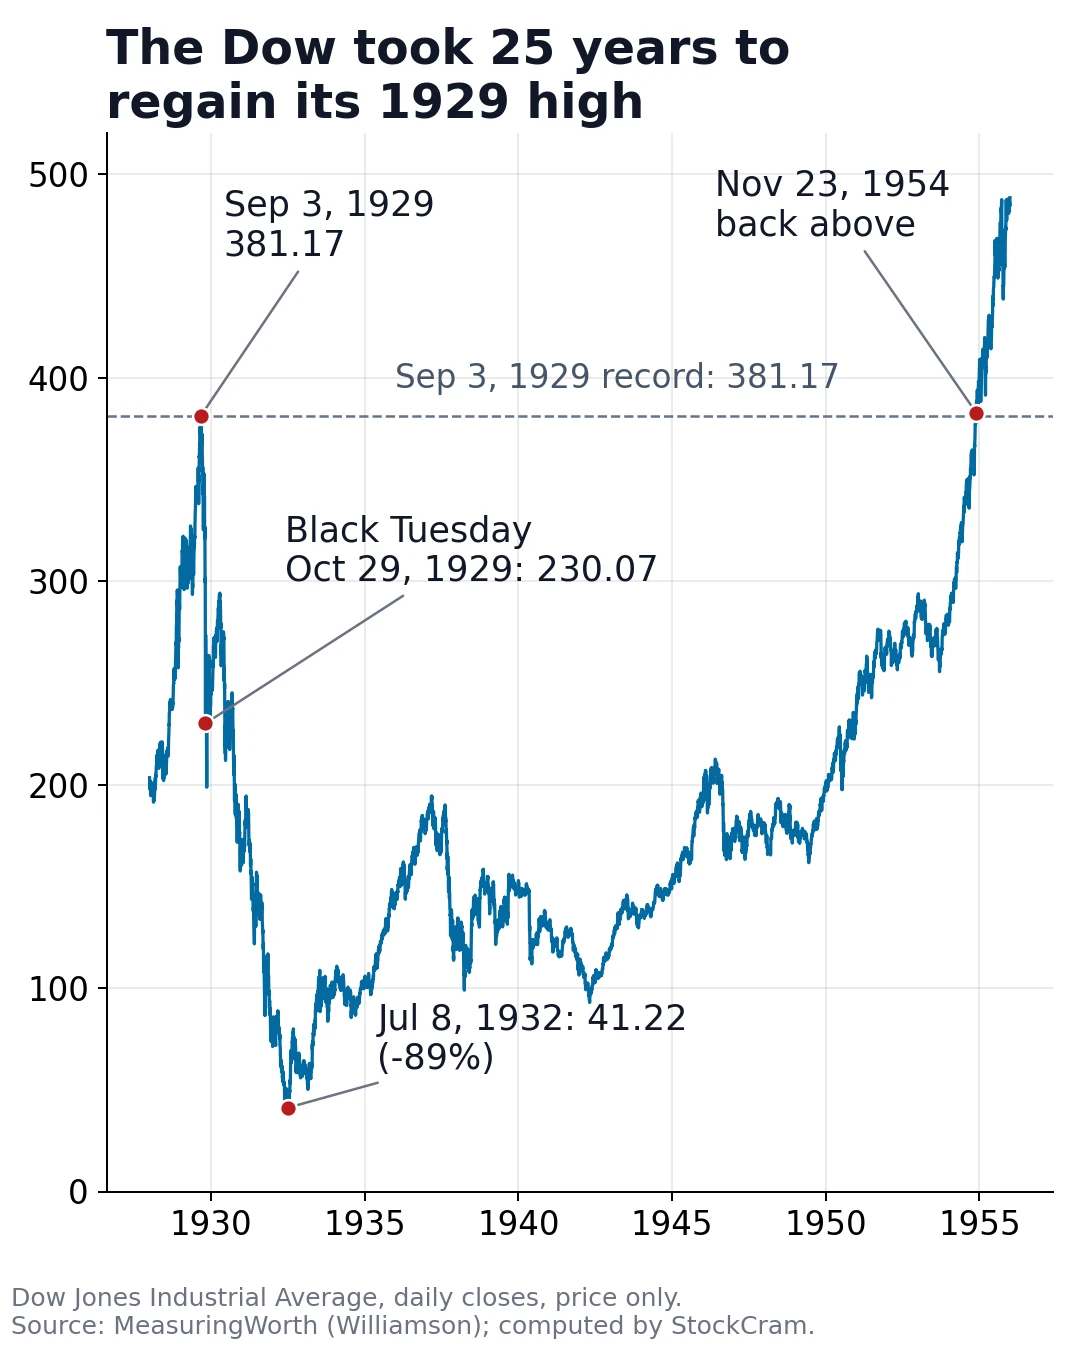
The 1929 stock market crash took the Dow Jones from a record 381.17 on September 3, 1929 to 41.22 on July 8, 1932, a fall of 89%, and the Dow did not close above its 1929 high again until November 23, 1954.
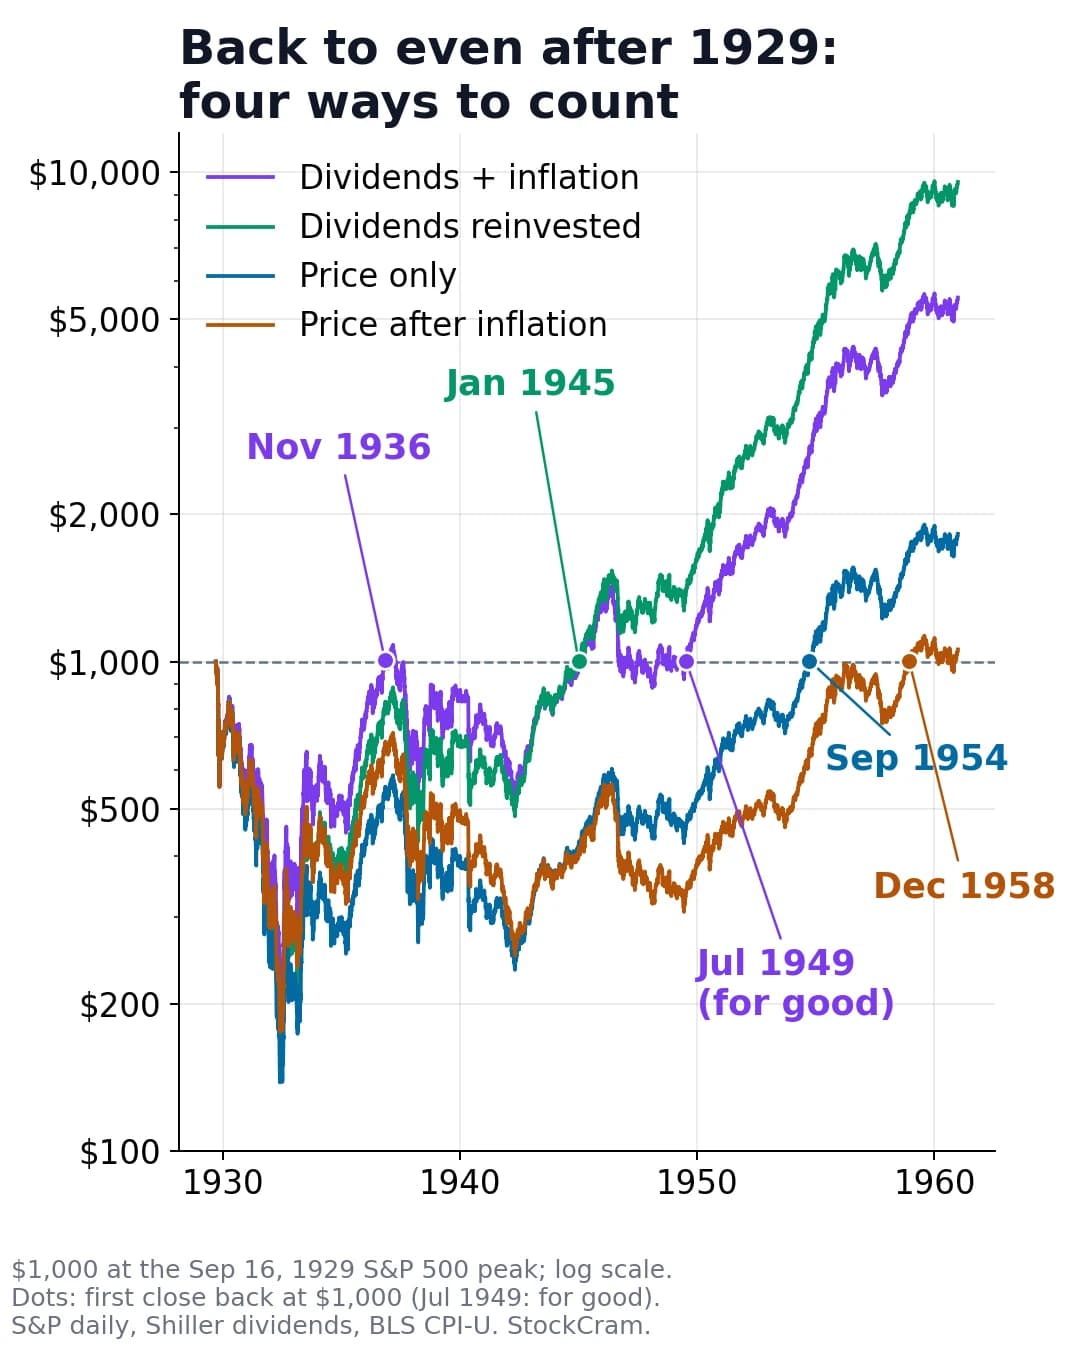
That is where the famous "25 years to recover" comes from, and it counts price alone. Counting the dividends companies paid, and the fall in consumer prices (deflation) in the early 1930s, the broader S&P composite, measured from its 1929 peak, was briefly back to even in late 1936 and back for good in July 1949, about 20 years later. Counting dividends alone, without adjusting for prices, the S&P composite took about 15 years. This page shows each measure, computed from daily data, so you can see where each figure comes from.
Free · pretend money
1929 stock market crash simulator: what would you have done?
12 moments, real S&P composite closes, about 7 minutes. You only see the news of each day.
Historical simulation with pretend money. Past performance does not indicate future results. Not investment advice.
The sections below cover Black Thursday, Black Monday and Black Tuesday 1929, the four ways to measure the recovery, and why the Great Depression made it so long.
The Dow Jones Industrial Average closed at a record 381.17 on September 3, 1929. Eight weeks later it was 40% lower. The worst days were Monday, October 28, when the Dow fell 12.8%, and Tuesday, October 29, when it fell another 11.7%. Those are the days known as Black Monday and Black Tuesday.
The crash was only the start. From there the index kept falling, unevenly, for almost three years, to 41.22 on July 8, 1932, 89% below its record. The Federal Reserve's history of the crash describes what followed as "our nation's longest, deepest depression." The Dow did not close above 381.17 again until November 23, 1954.
The broader S&P composite index peaked within two weeks of the Dow. Its highest weekday close was 31.86 on September 16, 1929. S&P's own records put the high at 31.92 on Saturday, September 7, because the New York Stock Exchange also traded on Saturday mornings then. Either way, it fell 86% to its own bottom on June 1, 1932. In money terms, $1,000 in it at the September 16 close was worth $641 at Black Tuesday's close and $138 at the bottom. The recovery figures below use the S&P composite because it is broader than the Dow and Robert Shiller's long-run dividend and price data cover it. In 1929 it tracked 90 stocks; the 500-stock S&P 500 only launched on March 4, 1957, according to S&P Dow Jones Indices. So these are reconstructed historical estimates, not the returns of any fund a 1929 investor could buy.
Daily closes from MeasuringWorth's Dow series. The Saturday, October 26 session is included, so Black Monday's change is measured from Saturday's close. Historical data shown; past performance does not indicate future results.
| Date | Dow close | Change that day | Below the Sept 3 record |
|---|---|---|---|
| Tue, Sep 3, 1929 (record) | 381.17 | n/a | 0% |
| Wed, Oct 23, 1929 | 305.85 | -6.3% | -19.8% |
| Thu, Oct 24, 1929 (Black Thursday) | 299.47 | -2.1% | -21.4% |
| Mon, Oct 28, 1929 (Black Monday) | 260.64 | -12.8% | -31.6% |
| Tue, Oct 29, 1929 (Black Tuesday) | 230.07 | -11.7% | -39.6% |
| Wed, Nov 13, 1929 (1929 low) | 198.69 | n/a | -47.9% |
| Fri, Jul 8, 1932 (bottom) | 41.22 | n/a | -89.2% |
| Tue, Nov 23, 1954 (back above) | 382.74 | n/a | +0.4% |
By price alone, through the Great Depression and beyond, 25 years: the Dow regained its 1929 high on November 23, 1954, and the broader S&P composite on September 22, 1954. It is accurate for what it measures, which is the index level with no dividends and no adjustment for prices.
Measured as a reconstructed broad-market series, with dividends reinvested and no taxes or trading costs, the answer is different, and it depends on two choices: whether you count dividends, and whether you adjust for prices.
So "25 years" is too long by one measure and too short by another. To see how inflation changes a return over any period, try the inflation-adjusted return calculator, which uses rates you enter rather than historical data. Each date in the table below is the first close at or above the 1929 peak level.
"Back to even" is the first close at or above the peak level. Price-only rows use daily closes; rows with dividends or inflation are accurate to about a month because those inputs are monthly. A second calculation using only Shiller's monthly series lands in the same month for three measures and one month earlier for price after inflation. "Sustained recovery" means the series never closed below the peak level again in our daily data through 1960, nor averaged a month below it in Shiller's monthly data (our downloaded copy ends in September 2023); by then the index was far above these levels. The late-1985 date is monthly only. Computed by StockCram (see Sources and Method). Historical data shown; past performance does not indicate future results.
| Measure | Dividends | Inflation | First back to even | Time after the peak | Sustained recovery in available data |
|---|---|---|---|---|---|
| Price | No | No | Sep 22, 1954 | About 25 years | Nov 3, 1954 |
| Total return | Reinvested | No | Jan 1945 | About 15 years | Jan 1945 |
| Price after inflation | No | Adjusted | Dec 1958 | About 29 years | Late 1985, monthly data (about 56 years) |
| Total return after inflation | Reinvested | Adjusted | Nov 1936 | About 7 years | Jul 1949 (about 20 years) |
Only by price. Counting dividends and falling consumer prices, the reconstructed S&P composite was back to its 1929 level twice before 1954: briefly in 1936, and for good in 1949.
The November 1936 recovery was brief. In our daily reconstruction, this series first crossed its 1929 starting level on November 4, 1936 and fell below it again by November 13. Exact crossing days depend on how the monthly dividend and inflation figures are spread across trading days, so read them as model estimates. The market fell back below its 1929 level that same month, dropped sharply again in 1937 and 1938, and in April 1942 the 1929 starting value, with dividends and inflation counted, was down to about half. It got back above for good in July 1949 (July 12 in our reconstruction), almost 20 years after the peak, and stayed above in every later observation we have. The price-only recovery wobbled too: the S&P composite slipped back under its 1929 peak in October 1954 before holding from November 3.
The start date matters as much as the measure. A reconstructed series that starts at the close on October 31, 1929, after the crash rather than at the peak, briefly returned to its starting level in the rally of early 1930, then fell far below. On the same basis, with dividends reinvested and adjusted for inflation, it first returned after the 1932 bottom in November 1935, about 6 years later, then slipped below again until 1943. When you see another figure, check which start date and which measure it uses.
Black Thursday was the day the panic began, but it was not the day the market fell most. You may read that the market "lost 11%" that day. That was roughly the fall at the worst point during trading, not at the close.
According to economist Harold Bierman's account on EH.net, the Dow dropped from about 306 to 272.32 during the session, on about three times the normal trading volume, and then recovered to close at 299.47. That close was down 2.1% on the day. The next morning's Wall Street Journal, as Bierman notes, credited New York bankers with stopping the decline with $1 billion of support.
The support bought two quiet days. On Friday the Dow closed slightly higher, and in Saturday's session slightly lower. The heavy losses came the next week.
On Black Monday 1929, the Dow fell from 298.97 to 260.64, a 12.8% drop from Saturday's close. On Black Tuesday it fell again, from 260.64 to 230.07, down 11.7%. The Federal Reserve's history describes the two days the same way: down "nearly 13 percent," then "nearly 12 percent." In two sessions the Dow lost almost a quarter of its value.
By the close on Black Tuesday the Dow was 40% below its September record. It kept falling to 198.69 on November 13, 1929, 48% below the record, before a rally in early 1930 and then the long slide to 1932. To see those weeks from the inside, one decision at a time, try our 1929 stock market crash simulator, a free replay with pretend money.
The name "Black Monday" also belongs to a later crash: on October 19, 1987 the Dow fell 22.6% in one day. That crash and its recovery are covered in our post on how long the market took to recover from Black Monday 1987.
Economists still disagree. Harold Bierman, writing for EH.net, notes that "no consensus exists about its precise causes." The factors most accounts point to are these:
Bierman's own argument is that efforts by officials and the press to stop speculation, and bad news for heavily borrowed utility stocks in October 1929, helped trigger the fall. Once prices dropped, investors who had borrowed had to sell to repay their loans, which pushed prices down further.
Two things helped that you won't see on a price chart.
Consumer prices fell (deflation). The U.S. consumer price index fell 27% from 1929 to spring 1933, so a dollar in 1933 bought about 37% more than a dollar in 1929. A portfolio that was still down in dollars was down less in what it could buy. Consumer prices did not return to their 1929 level until April 1943.
Dividends kept coming, even as prices collapsed. At the June 1932 low, the S&P composite's dividend yield was about 13.8%, because prices had fallen much further than payouts. Reinvested, those dividends bought shares at very low prices.
Taken together, $1,000 at the 1929 peak was worth $138 by price at the 1932 low, but $164 with dividends and $208 with dividends after inflation.
These are index figures, and they describe the market, not people. During the Depression many investors lost income or had to sell, and those who had bought on borrowed money were forced to sell as prices fell. An index that was back to even in buying power did not mean its owners were.
"After inflation" values are in September 1929 dollars, so they show buying power. Computed by StockCram from daily S&P composite closes, Shiller dividends and BLS CPI-U. Historical data shown; past performance does not indicate future results.
| Date | Price only | With dividends | With dividends, after inflation |
|---|---|---|---|
| Sep 16, 1929 (weekday peak) | $1,000 | $1,000 | $1,000 |
| Jun 1, 1932 (S&P low) | $138 | $164 | $208 |
| Sep 22, 1954 (price back to even) | $1,004 | $4,164 | $2,688 |
The 1987 crash was faster, and 1929's was far deeper. On October 19, 1987 the Dow fell 22.6% in one day, yet the S&P 500 was back above its 1987 high by price 21 months after the crash (23 months after its August 1987 peak), against 25 years after 1929. Unlike 1929, the 1987 losses were not followed by a recession or a banking crisis, according to the Federal Reserve's history. The 1987 recovery, with its own table, is covered in our Black Monday 1987 post. The Panic of 1907 sits in between: the Dow fell 48.5% and passed its old record by price 9 years and 8 months after it, as our Panic of 1907 post shows. After the dot-com bubble burst in 2000, the S&P 500 needed 7 years by price to first get back above its record, and the Nasdaq 15, as our dot-com bubble post shows.
The difference was what came after. The Federal Reserve's history traces part of it to the Fed's own 1929 rate rise: under the international gold standard it forced other central banks to raise rates too, and tight money "tipped economies around the world into recession." Problems elsewhere in the financial system then "turned what may have been a short, sharp recession into our nation's longest, deepest depression." In 1929 the economy was already shrinking before the crash: the National Bureau of Economic Research dates the recession's start to August 1929 and its end to March 1933. The crash was followed by the Great Depression and a long bear market, and the Dow fell another 82% below its Black Tuesday close (89% below its September record) before it found a bottom in 1932.
For how markets recovered from other shocks, see how stocks performed during past wars.
Short answers to the questions people ask most about the 1929 crash.
The crash ran over a week in late October 1929: Black Thursday, October 24, when panic selling began; Black Monday, October 28 (Dow down 12.8%); and Black Tuesday, October 29 (down 11.7%). The Dow's record had been 381.17 on September 3, 1929.
The Dow was down 40% from its record by Black Tuesday and 48% by November 13, 1929. The full fall, to July 8, 1932, was 89%.
25 years by price (November 1954 for the Dow). For the broader S&P composite with dividends reinvested, about 15 years. Adjust for falling consumer prices as well and it was briefly about 7 years (November 1936), and for good about 20 years (July 1949).
The recession began in August 1929, the crash came in October, and stocks bottomed in mid-1932. Measured from the 1929 peak, the Dow took until November 1954 to regain its high by price. For the broader S&P composite, reinvesting dividends shortens that to about 15 years; counting falling consumer prices as well, it was back for good in July 1949.
Panic selling took the Dow down to 272.32 during the day. It recovered to close at 299.47, down 2.1%, and the next day's Wall Street Journal credited New York bankers' buying. The large one-day losses came the following Monday and Tuesday.
There is no single agreed cause. Most accounts point to an eight-year run-up in prices, heavy buying on borrowed money (margin), heavily indebted investment trusts and utility holding companies, and the New York Fed's rate rise to 6% in August 1929. When prices fell, borrowers were forced to sell, which deepened the fall.
Method. "Back to even" is the first daily close at or above 31.86, the September 16, 1929 close and the highest in our data, which has no Saturday sessions. S&P's records show a Saturday high of 31.92 on September 7; measured from that level instead, every recovery date in this post comes out the same. Shiller's dividend figure for each month is an annual rate (the trailing four-quarter total), so we divide it by 12, spread it evenly over that month's trading days and add it to the daily price change. Inflation-adjusted values divide each day's level by that month's CPI-U. Our Dow figures are for a price-weighted index of 30 companies whose members changed over the years; the S&P composite tracked 90 stocks in 1929, and the 500-stock S&P 500 launched in March 1957 (S&P Dow Jones Indices). Dividends are reinvested in proportion to the index level each day, compounding, and the price series used has no dividends of its own, so nothing is counted twice. The total-return figures assume dividends were reinvested at no cost and with no tax; no index fund existed in 1929, so they describe the market, not any one investor. A second check that uses only Shiller's monthly averages gives the same month for three measures and one month earlier for price after inflation. "Sustained recovery" dates use daily closes through 1960, then Shiller's monthly averages through September 2023, where our downloaded copy of his data ends. Dates that depend on dividends or inflation are model estimates, accurate to about a month.
Historical data shown; past performance does not indicate future results. StockCram is an educational platform, not a broker-dealer or investment adviser, and nothing on this page is investment advice.
Every post in this series measures crashes the same way; our market-history method explains how.
The Dow fell 89% from September 1929 to July 1932
Black Monday (Oct 28, -12.8%) and Black Tuesday (Oct 29, -11.7%) were the worst days of the crash; Black Thursday closed down 2.1%.
"25 years" is the price-only recovery
Reinvesting dividends cut it to about 15 years. In the reconstructed series, also counting falling consumer prices, it was briefly back after about 7 years and back for good after about 20.
Start date and measure decide the answer
Published figures differ because each measures from a different day or counts different things. When you see a recovery figure, ask which start date and which measure it uses.
The Nasdaq fell 78% after March 2000 and took 15 years to regain its high. The S&P 500 fell 49%, was back by 2007, and has stayed above its 2000 record since 2013.
On October 19, 1987 the S&P 500 fell 20.47% in a day. What caused it, and when the market recovered: 21 months by price, about 19 with dividends, over 4 years after inflation.
The Dow fell 48.5% from its January 1906 high to its November 1907 low, mostly before the October bank runs. Recovery came in 1908 counting dividends, and in 1915 by Dow price.