


What Backtesting Actually Is
Once your strategy is written out as precise rules, the obvious next question is: would this have worked? Backtesting answers a narrower version of that — it replays your fully specified rules against historical prices and records what the strategy would have done had it been running back then. Think of it like rewinding a game tape and letting your playbook call every move, so you can see how it would have scored. No real money changes hands; the computer just steps through the past, day by day, applying your rules exactly.
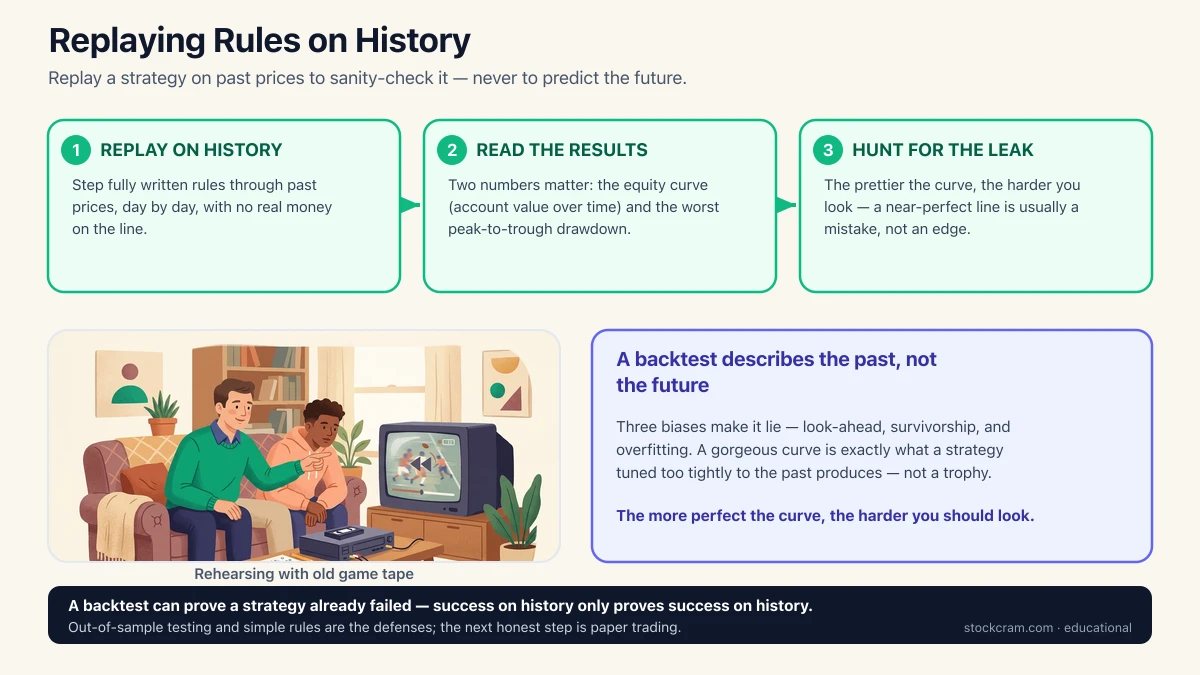
The two numbers people fixate on are the equity curve — a line of your account's value over time — and the drawdown, the worst peak-to-trough drop along that line. A rising equity curve looks like success; the drawdown tells you how much pain you'd have sat through to get it. Both are just descriptions of one particular slice of history.
The One-Sentence Version
A backtest is a dress rehearsal on old footage: it estimates how your rules would have behaved on the past, using no real money — helpful for catching obvious problems, but it's a description of history, not a forecast.
A Reality Check, Not a Crystal Ball
Here's the trap that catches almost everyone: a great backtest feels like proof the strategy will keep working. It isn't. Markets change — the crowd, the rules, the interest-rate backdrop, the very patterns a strategy leans on. A rule that shone across the last decade can still fail tomorrow, because tomorrow is not drawn from the same deck as yesterday.
Say it plainly
A backtest describes the past; it does not predict the future. It can tell you a strategy already failed on history (useful — you can discard it), but a strategy that succeeded on history has proven only that: it succeeded on history. Past results never guarantee future ones.
Reading an Equity Curve
To make this concrete, here's the shape people hope to see when they run a backtest — an account value that climbs over time, with a couple of scary dips along the way. Watch what happens to the line, and keep in mind these are made-up numbers meant only to show the shape:
Illustrative only — invented numbers to show the shape of an equity curve, not a real or expected result. A smooth, mostly rising curve like this is exactly what an overfitted strategy also produces, which is why the picture alone proves nothing.
Notice the dip from Year 4 to Year 5, and again at the end — those wobbles are the drawdowns, the stretches where the strategy was underwater. Now here's the uncomfortable part: a curve this clean is also exactly what you get when a strategy has been quietly tuned to fit the past too well. The prettiness of the line tells you nothing about whether the underlying idea is real. So before you trust a curve like this, it pays to practice interrogating one — which is exactly what the rest of this lesson does.
Exercise: Spot the Broken Backtest
Backtests don't lie on purpose — they faithfully report what you asked. The lie sneaks in through how you set the test up. Below are four backtests that each look fantastic. For each, ask what's wrong here? before opening the reveal. Three of the flaws are the classic biases every serious backtester hunts for; the fourth is the friction that quietly eats a strategy alive.
Vignette 1 · The strategy that's never wrong
The setup. A momentum rule buys each morning, and the backtest is an almost unbroken rising line — calling the direction right on roughly 90% of days, with barely a losing week in a decade.
What's wrong here? A ~90% daily hit rate should feel impossible. Where is the foresight coming from?
The flaw: look-ahead bias
The code used each day's closing price to place a trade at the open — using information it couldn't have known at that moment — it saw the answers early. That is look-ahead bias, and it's a bug: the strategy peeked at the future. The fix is to feed the test only data that was actually available at each point in time.
Vignette 2 · The basket that never breaks
The setup. You backtest a rule that just holds the biggest companies over the last 20 years. The equity curve barely dips — even the worst crashes look like gentle speed bumps.
What's wrong here? Real decades contain real disasters. Why does this one look so much safer than the market you lived through?
The flaw: survivorship bias
The dataset only included companies that survived to today. The ones that went bust or were delisted were silently deleted, so the past looks safer than it was. That is survivorship bias — a bad dataset, the corpses swept off the field before the test began. The fix is a dataset that includes the losers and delisted names, not just today's winners.
Vignette 3 · The flawless ten-year run
The setup. After trying a hundred parameter combinations, you keep the one whose backtest turns an illustrative $10,000 into $40,000 over ten years with barely a dip.
What's wrong here? No bug, no bad data — so why should near-perfection make you more suspicious, not less?
You went fishing for the winner
Testing a hundred combinations and keeping the best means you searched a whole sea of settings and landed the luckiest one for this single history.
It memorized noise, not a pattern
The strategy learned the random luck of one particular decade by heart instead of a real, repeatable edge. That is overfitting — subtler and the hardest to catch, because nothing looks broken.
How to guard against it
Keep rules simple, use few adjustable knobs, and check the strategy on data it never saw during design — the defense covered next.
Vignette 4 · The tireless money machine
The setup. A rule that trades hundreds of times a day produces a smooth curve, minting a sliver of profit on nearly every round trip.
What's wrong here? The logic checks out and the data is honest. So what did the simulation forget to charge?
The flaw: ignoring trading costs and slippage
The backtest assumed every trade filled at the exact price it wanted, for free. Real trading pays commissions and slippage — the gap between the price you expected and the price you actually got. On a handful of trades that's a rounding error; across hundreds of trades a day those tiny costs compound and can erase the entire edge. The fix is to subtract realistic costs and slippage from every simulated trade.
How Careful Backtesters Fight Back
The main defense is out-of-sample testing: you split your history in two, design and tune the strategy on the first chunk, then run it once on the second chunk it has never seen. If the strategy only shines on the data it was tuned on and falls apart on the held-back data, you've caught overfitting red-handed. Alongside that, the quiet discipline is keeping rules simple — the fewer knobs you can twist, the less room there is to accidentally memorize noise. A strategy with two sensible rules is far harder to overfit than one with fifty fiddly parameters.
Even a clean out-of-sample result is still history. The next step, covered later in this course, is paper trading — running the strategy forward on live markets with fake money, so it faces prices that hadn't happened yet when it was built. That's the closest thing to an honest test before any real capital is ever at risk.
The Real Lesson: Distrust the Perfect Curve
That's the mindset shift this lesson is really about. A gorgeous backtest is not a trophy — it's a prompt to ask what did I get wrong? The more perfect the curve, the harder you should look for the leak, because in noisy markets, near-perfection is far more often a sign of a mistake than of a genuine discovery.
Educational use only
Educational content only. StockCram isn't a broker or adviser, and we have no affiliation with any institution or tool we mention. Nothing here is a recommendation to trade in any particular way.