


Garbage In, Garbage Out
In the last lesson we turned a strategy into precise rules. But those rules never touch the market directly — they touch data about the market. And there's a catch worth sitting with: a trading system is only as good as the numbers you feed it. Every clever rule, every risk check, every backtest sits on top of the data, and inherits every flaw in it. Feed the machine a wrong price and it doesn't know the price is wrong — it just trades on it, confidently, at the speed of a computer.
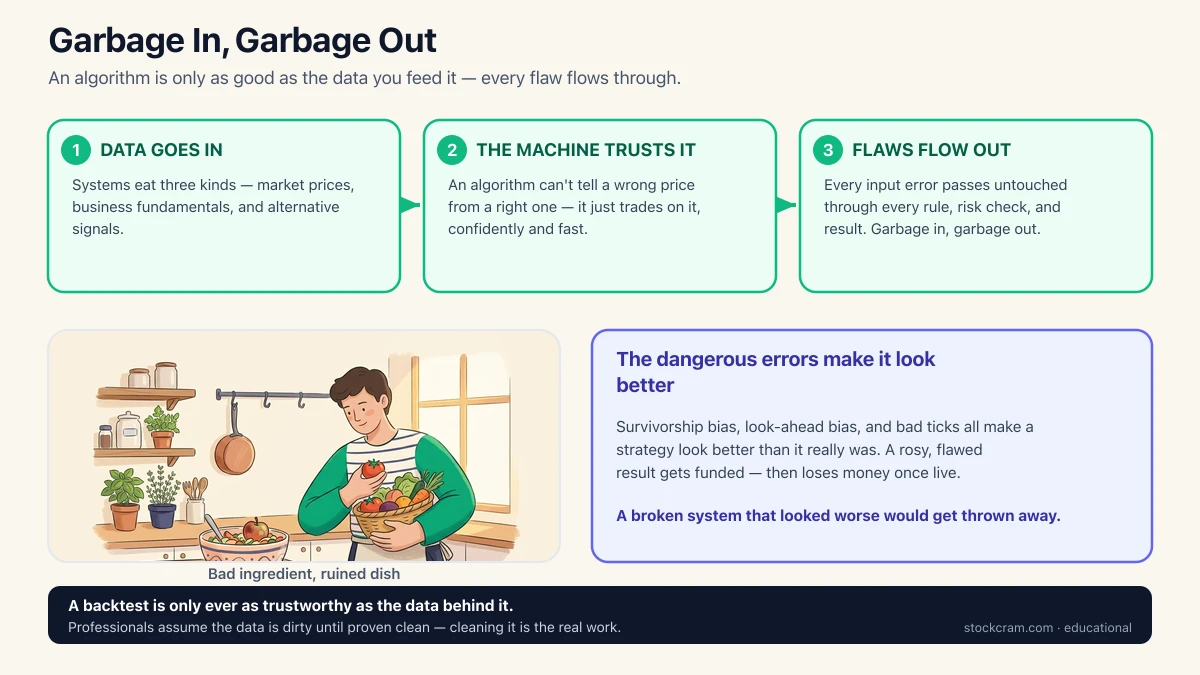
Programmers have a name for this: garbage in, garbage out. It means a system's output can never be more trustworthy than its input. A calculator given the wrong numbers still adds them perfectly — and hands you a perfectly wrong answer. Most beginners obsess over the strategy and treat the data as a given. Professionals do the opposite: they assume the data is dirty until proven clean.
The One-Sentence Version
An algorithm doesn't see the market — it sees a spreadsheet of numbers someone collected about the market. If those numbers are wrong, delayed, or misleading, no amount of clever code can save it.
The Three Kinds of Data Algorithms Eat
Almost everything a trading system consumes falls into one of three buckets. The first is market data — the prices a stock trades at, how much volume changes hands, and the bid-ask spread between the best buy and sell offers. This is the heartbeat of any system: it's what tells the algorithm what things cost right now.
The second is fundamental data — the health of the actual business behind the stock: quarterly earnings, revenue, debt on the balance sheet. This is the raw material of fundamentals, and it changes slowly, a few times a year, rather than every second. The third is alternative data — creative, indirect signals that aren't about markets at all: satellite photos counting cars in a retailer's parking lots, website-traffic counts, anonymized credit-card spending panels, or the tone of news headlines. The idea is to glimpse how a business is doing before the official numbers come out.
Each kind of data has a personality — a typical example, and a typical way it quietly goes wrong. The whole menu on one plate:
| Data type | Example | Common gotcha |
|---|---|---|
| Market data | A stock's price and trading volume, tick by tick | Bad ticks — a stray price that never truly traded, plus gaps and timezone mix-ups |
| Fundamental data | Quarterly earnings, revenue, debt on the balance sheet | Point-in-time errors — using a figure that was later restated, so it wasn't really known yet |
| Alternative data | Satellite photos of parking lots, web traffic, card-spending panels | Expensive, noisy, and often far less predictive than it's sold to be |
| Corporate actions | Stock splits, dividends, ticker changes | Un-adjusted history makes a 2-for-1 split look like an overnight 50% crash |
The data an algorithm eats — and the quiet way each kind tends to be wrong. The gotcha column is where systems actually fail.
Notice that last column. None of these gotchas announce themselves — there's no error message. The data looks perfectly reasonable; it's just subtly wrong in a way that flatters your strategy. Those quiet errors are worth their own section, because they're the ones that fool even careful people.
When Good-Looking Data Lies
The most dangerous data errors aren't the obvious ones. A price of −$5 gets caught instantly. The killers are the errors that leave the numbers looking sensible while quietly tilting the whole picture in your favor. Three show up again and again.
Survivorship bias is the sneakiest. Imagine you download today's list of 500 big companies and test a strategy on their last 20 years of prices. Sounds fair — but that list only contains the companies that survived. Every business that went bankrupt or got delisted has silently vanished from your data. You've accidentally tested a strategy on a universe of guaranteed winners, and it looks brilliant. In one illustrative example, a strategy might show a tidy 12% a year on the survivors and barely break even once the failed companies are added back. The failures were the whole point, and they're gone.
Look-ahead bias — sometimes called a point-in-time problem — means using a number the algorithm couldn't actually have known yet. A company reports earnings, then revises them two months later. If your data quietly stores the revised figure on the original date, your backtest is peeking at the answer key. It'll look like your system brilliantly predicted the news, when really it just read tomorrow's newspaper. Third are the plumbing errors: gaps, bad ticks, and adjustment mistakes — a missing day, a stray price, or a stock split that wasn't accounted for, which can make a normal $100 stock look like it crashed to $50 overnight.
Why these are so dangerous
Every one of these errors makes a strategy look better than it really is. That's what makes them lethal — a broken system that looked worse would get thrown away, but one that looks great on flawed data gets funded, launched, and then loses money in the real world where the survivors weren't guaranteed and the earnings weren't known in advance.
Clean, Fast Data Is Expensive
A lot of the advantage big trading firms have has nothing to do with a smarter idea. It comes down to better data. Cleaner history that's already corrected for splits and survivorship. Faster feeds that arrive milliseconds sooner. Exotic alternative datasets that cost more per year than a house. When two firms run a similar strategy, the one with cleaner, fresher, more complete data tends to win, not because it's more brilliant, but because it's working from a more honest picture of reality.
This is why data is a real budget line, not an afterthought. Historically, serious firms have spent enormous sums buying, cleaning, and storing data — and hiring people whose entire job is making sure the numbers can be trusted. For a beginner, the lesson isn't to go buy expensive feeds; it's to be humble about the free data you can get, and honest about its limits.
Where the Real Work Actually Lives
Nobody dreams of becoming a trader so they can spend their days fixing timezone stamps and hunting down a missing dividend. But that unglamorous cleaning and checking is where much of the real work — and most of the quiet failures — actually live. The exciting part, the strategy, is often the easy part. Making sure the data behind it is trustworthy is the hard, tedious, essential part almost everyone underestimates.
This ties directly into what's next. In the following lesson we'll cover backtesting — testing a strategy on historical data to see how it would have behaved. But a backtest is only ever as trustworthy as the data behind it. If survivorship bias or look-ahead errors are hiding in your history, your backtest will hand you a confident, beautiful, and completely fictional result. Good data isn't a boring prerequisite to the interesting work — it is the interesting work, in disguise.
Educational use only
Educational content only. StockCram isn't a broker or adviser, and we have no affiliation with any institution or tool we mention. Nothing here is a recommendation to trade in any particular way.