
Dot-Com Bubble Burst: How Long Did It Take to Recover?
The Nasdaq fell 78% after March 2000 and took 15 years to regain its high. The S&P 500 fell 49%, was back by 2007, and has stayed above its 2000 record since 2013.
15 min read
Read Article
The S&P 500 fell 57% from October 2007 to March 2009. By price it regained its record in March 2013; with dividends, in 2012.

Educational purposes only. This content does not constitute investment advice. Read our disclaimer
StockCram is not a broker-dealer, investment adviser, or financial institution. All content is for educational and informational purposes only and should not be construed as personalized investment advice. Consult a qualified financial professional before making investment decisions. Past performance does not guarantee future results.
The 2008 stock market crash took the S&P 500, an index of 500 large US companies, down 57% from its record close on October 9, 2007 to its low on March 9, 2009. Its price did not close above that record again until March 28, 2013: five and a half years after the peak, and four years after the low. With dividends reinvested it got back sooner, in 2012: on April 2 for the index's own total-return measure, and on August 16 for SPY, a popular S&P 500 index fund.
Answers to "how long did it take" range from about four to six years. They start and stop the clock in different places: at the peak or at the low, with or without dividends, before or after inflation. This page lays the measures side by side. Every price date comes from daily closes checked against a second data source, through October 30, 2026.
Free · pretend money
2008 financial crisis simulator: what would you have done?
12 moments, real S&P 500 closes, about 7 minutes. You only see the news of each day.
Historical simulation with pretend money. Past performance does not indicate future results. Not investment advice.
Our free replay starts you in January 2007 with $10,000 in pretend money. At 12 moments, from the first warnings to the rebound in 2009, you decide how much stays in the stock market (all of it, half, a quarter or none), knowing only that day's news. The replay ends in December 2009 with the market still 21% below where it started and 29% below its October 2007 record.
"Recovered" on this page means ending a trading day (the closing price) back above an earlier level. Unless a measure says otherwise, that level is the S&P 500's October 9, 2007 record. Past performance does not guarantee future results.
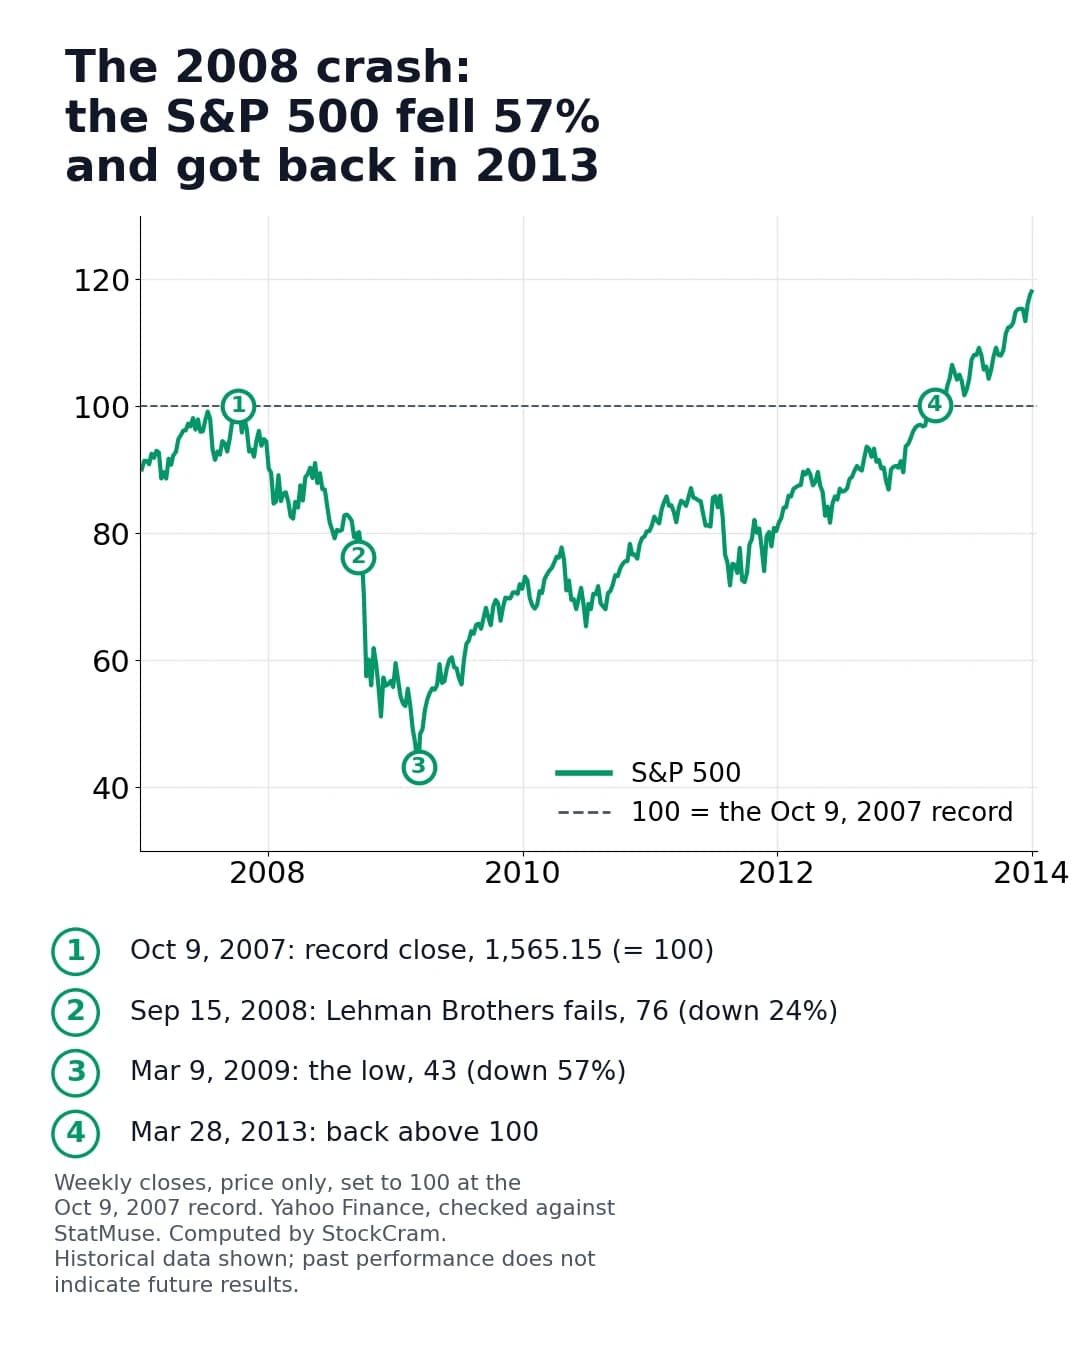
It took the S&P 500 five and a half years to recover from the 2008 crash by price: from its October 9, 2007 record of 1,565.15 to its first close above it on March 28, 2013. It closed at or below the record one last time on April 22, 2013, and has stayed above it since. Start the count at the March 9, 2009 low instead and the same recovery took four years.
Count the dividends, the cash many companies pay their shareholders, and the wait drops to about four and a half years. The S&P 500's total-return index, which assumes every dividend is reinvested at no cost, first closed above its October 2007 level on April 2, 2012. SPY, the best-known fund that tracks the index, got there on August 16, 2012, after four years and ten months. The two got back months apart: a fund pays small fees and handles dividends a little differently from the index, and that small gap was enough to move the date. Both dividend measures dipped back below one last time in late November 2012 and have stayed above since.
Inflation pushes the date back out. Prices of everyday things rose about 12% between October 2007 and late 2013, so getting back to the same number of dollars was not the same as getting back the same buying power. Adjusted for that (a real return), the S&P 500 by price got back in about October 2013, six years after the peak. Counting SPY's dividends too, it got back in about March 2013: the dividends roughly made up for the inflation.
The clock can also start later. Lehman Brothers, a large Wall Street investment bank, filed for bankruptcy on September 15, 2008, and the S&P 500 closed at 1,192.70 that day. It slipped back and forth around that level for about two weeks, then fell far below it. After the March 2009 low, it did not close above 1,192.70 again until April 9, 2010, about 19 months after Lehman failed. It dipped below again in 2010 and 2011, the last time on November 28, 2011.
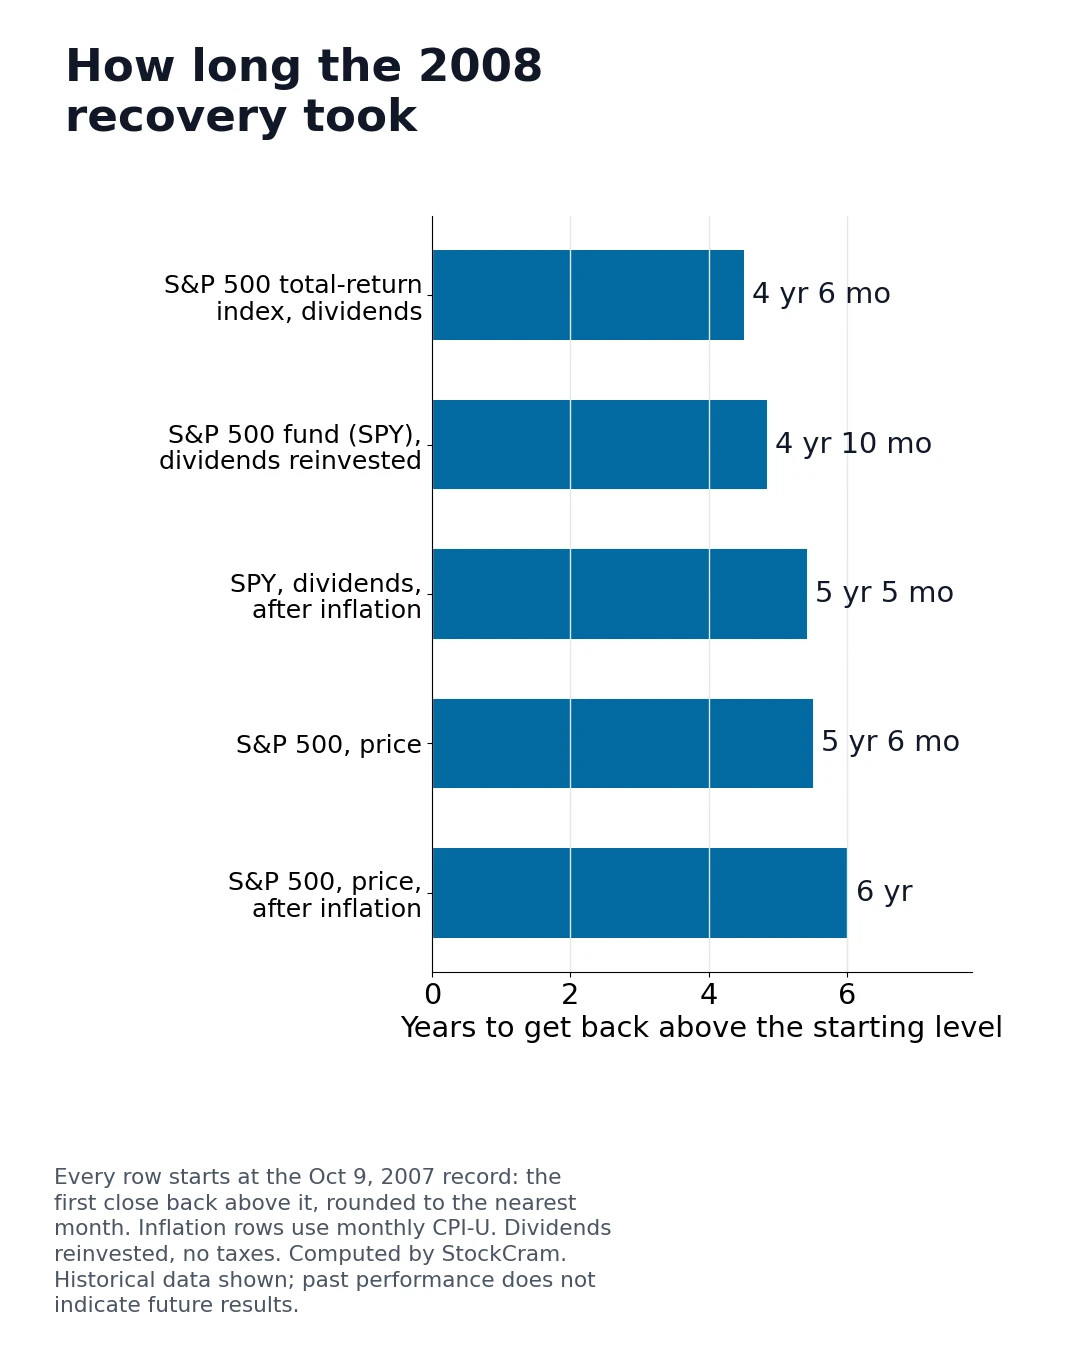
"Back above" is the first close above the level each row is trying to regain: the October 9, 2007 record, except in the Lehman row, where it is that day's close, counted after the March 2009 low. Times run from the starting date shown, rounded to the nearest month. Inflation rows use the monthly consumer price index, so they are accurate to the month. SPY's dividend-adjusted closes include its small fund fees. Checked through October 30, 2026. The chart after the table draws the five measures that start at the October 2007 record. Historical data shown; past performance does not indicate future results.
| Measure | Starting point | Back above | Time |
|---|---|---|---|
| S&P 500 total-return index, dividends reinvested | Oct 9, 2007 record | Apr 2, 2012 | 4 years 6 months |
| S&P 500 index fund (SPY), dividends reinvested | Oct 9, 2007 record | Aug 16, 2012 | 4 years 10 months |
| S&P 500, price | Oct 9, 2007 record | Mar 28, 2013 | 5 years 6 months |
| S&P 500 fund (SPY), dividends reinvested, after inflation | Oct 2007 record | Mar 2013 | about 5 years 5 months |
| S&P 500, price, after inflation | Oct 2007 record | Oct 2013 | about 6 years |
| S&P 500, price, from the March 2009 low | Mar 9, 2009 low | Mar 28, 2013 (the 2007 record) | 4 years |
| S&P 500, price, bought on Lehman day | Sep 15, 2008 | Apr 9, 2010 (after the 2009 low; it was briefly above in Sep 2008) | 1 year 7 months |
| Dow, price | Oct 9, 2007 record | Mar 5, 2013 | 5 years 5 months |
From its record close to its low, the S&P 500 dropped 56.8% in the 2008 crash and the Dow 53.8%. The Nasdaq Composite fell 55.6% from its October 2007 high (its record dated from 2000). All three reached their lowest close on the same day, March 9, 2009. In dollars, $10,000 that tracked the S&P 500 from its record was worth $4,322 at the low, before dividends.
The often-quoted figure for 2008 itself is smaller, because a calendar year starts and ends on arbitrary days. From the last close of 2007 (1,468.36) to the last close of 2008 (903.25), the S&P 500 fell 38.5% by price, or about 37% with dividends reinvested. The fall then kept going into 2009. The chart after the table follows the S&P 500 week by week, from the record to the day it got back.
"$10,000 became" follows $10,000 from each index's 2007 high close to its low on March 9, 2009, price only, without dividends. Historical data shown; past performance does not indicate future results.
| Index | 2007 high close | Low close (Mar 9, 2009) | Fall | $10,000 became |
|---|---|---|---|---|
| S&P 500 | 1,565.15 (Oct 9, 2007, a record) | 676.53 | -56.8% | $4,322 |
| Dow Jones Industrial Average | 14,164.53 (Oct 9, 2007, a record) | 6,547.05 | -53.8% | $4,622 |
| Nasdaq Composite | 2,859.12 (Oct 31, 2007; its record was set in 2000) | 1,268.64 | -55.6% | $4,437 |
Measured from the market's peak, the 2008 stock market crash started in October 2007, almost a year before Lehman Brothers failed. The S&P 500 set its record on October 9, 2007, and by July 9, 2008 it had closed 20% below it, the usual line for a bear market. In March 2008, Bear Stearns, another Wall Street investment bank, had agreed to be sold to JPMorgan Chase in a rescue backed by the Federal Reserve.
The timeline below runs from that record to the day prices got all the way back, five and a half years later. The coral half is the fall; the green half is the climb back.
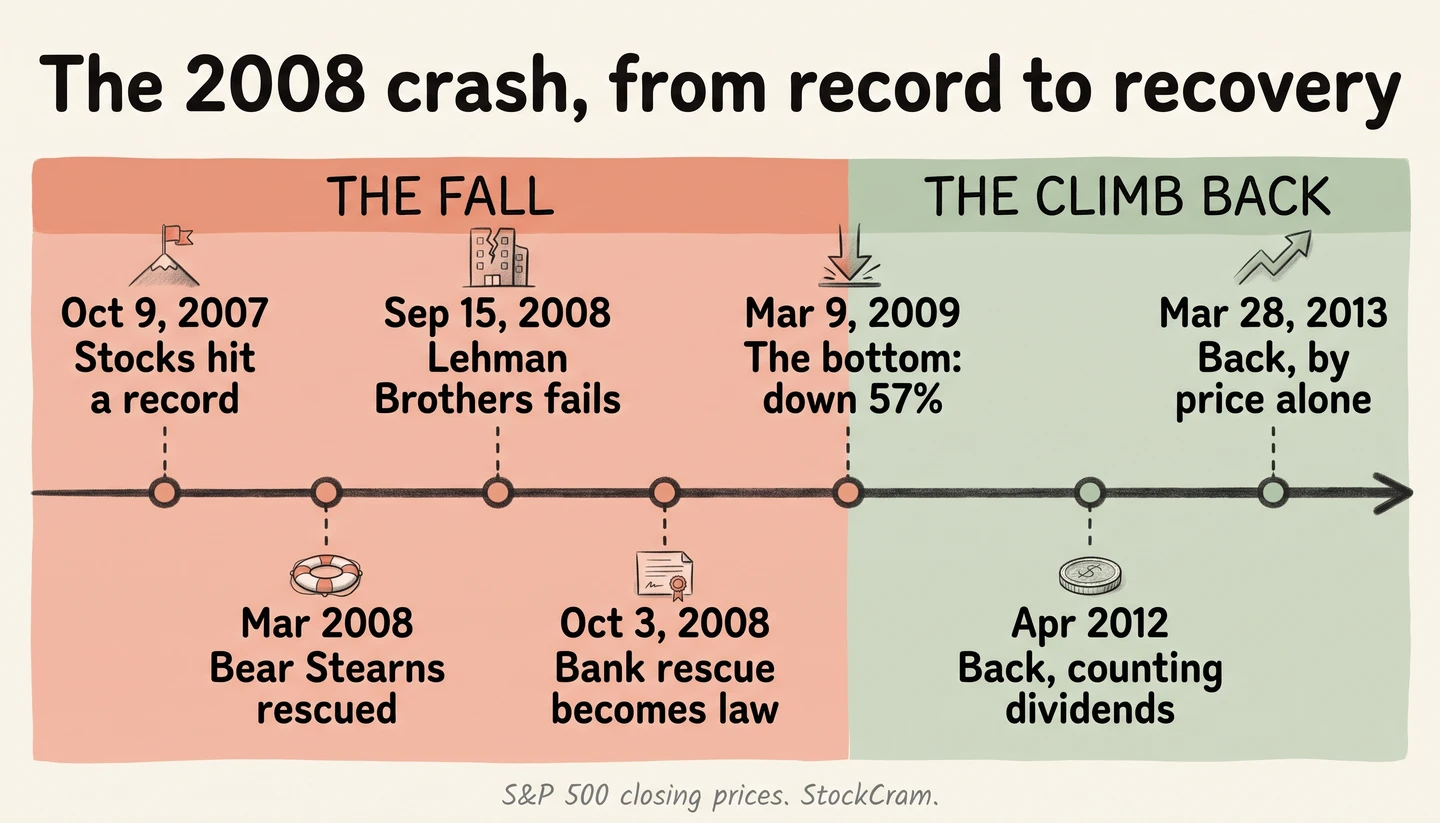
The fall took 17 months, and the fastest part came in its last six. On Monday, September 15, 2008, Lehman Brothers filed for bankruptcy and the S&P 500 fell 4.7%. From that day's close to the March 2009 low it lost another 43%. The economy was in recession for most of that time: the National Bureau of Economic Research later dated the recession from December 2007 to June 2009. The bottom for stocks came on March 9, 2009, three months before the recession's end.
The worst day of the 2008 stock market crash was October 15, 2008, when the S&P 500 fell 9.03%. All five of the worst days came between late September and early December 2008. So did the two best, and the biggest gain landed two days before the biggest loss. Between September 2008 and March 2009 the index moved 5% or more, up or down, on 21 trading days.
Daily change from the previous close, 2007 to 2009, price only. Historical data shown; past performance does not indicate future results.
| Date | Change | Close |
|---|---|---|
| Oct 15, 2008 | -9.03% | 907.84 |
| Dec 1, 2008 | -8.93% | 816.21 |
| Sep 29, 2008 | -8.81% | 1,106.42 |
| Oct 9, 2008 | -7.62% | 909.92 |
| Nov 20, 2008 | -6.71% | 752.44 |
| Oct 13, 2008 | +11.58% | 1,003.35 |
| Oct 28, 2008 | +10.79% | 940.51 |
Yes, though the closes cannot show whether the rescues made it worse or stopped something worse. After a bank rescue of up to $700 billion became law on October 3, 2008, the S&P 500 fell another 38%, to its March 2009 low. By October 3 it was already 30% below its record. On September 29, 2008 the House had voted down the first version of the rescue, 228 to 205, and the S&P 500 fell 8.81%. A revised version passed, and on October 3, the day it became law, the index closed at 1,099.23. On October 8 the Federal Reserve and five other central banks cut interest rates together. The next day the S&P 500 closed at 909.92, 17% below its October 3 close. Four of the five worst days, and the March 2009 low, came after the rescue became law.
Whether the rescues helped is a question the closes cannot answer, since 2008 happened only once, with them. The closes do record what owning stocks was like that winter. Rescues arrived and sharp rallies came and went, and the low still came five months after the law passed. Our 2008 stock market crash simulator walks you through those weeks one headline at a time.
If you added money every month, as many workplace retirement plans do, you got back above your own deposits long before a lump sum invested at the peak did. Take $100 put into an S&P 500 index fund (SPY) on the first trading day of each month from October 2007, bought at that day's closing price in fractional shares, with dividends reinvested. In percentage terms the worst point came on November 20, 2008, when $1,400 of deposits was worth $804, 43% under what had gone in. By September 16, 2009, six months after the market's low, the account had climbed back over its deposits, and from September 2010 it stayed above them, though only just in October 2011. The lump sum invested at the October 2007 peak needed until August 2012.
The chart follows both, each measured against the money that went into it. Above the dashed line, an account was worth more than had been paid in.
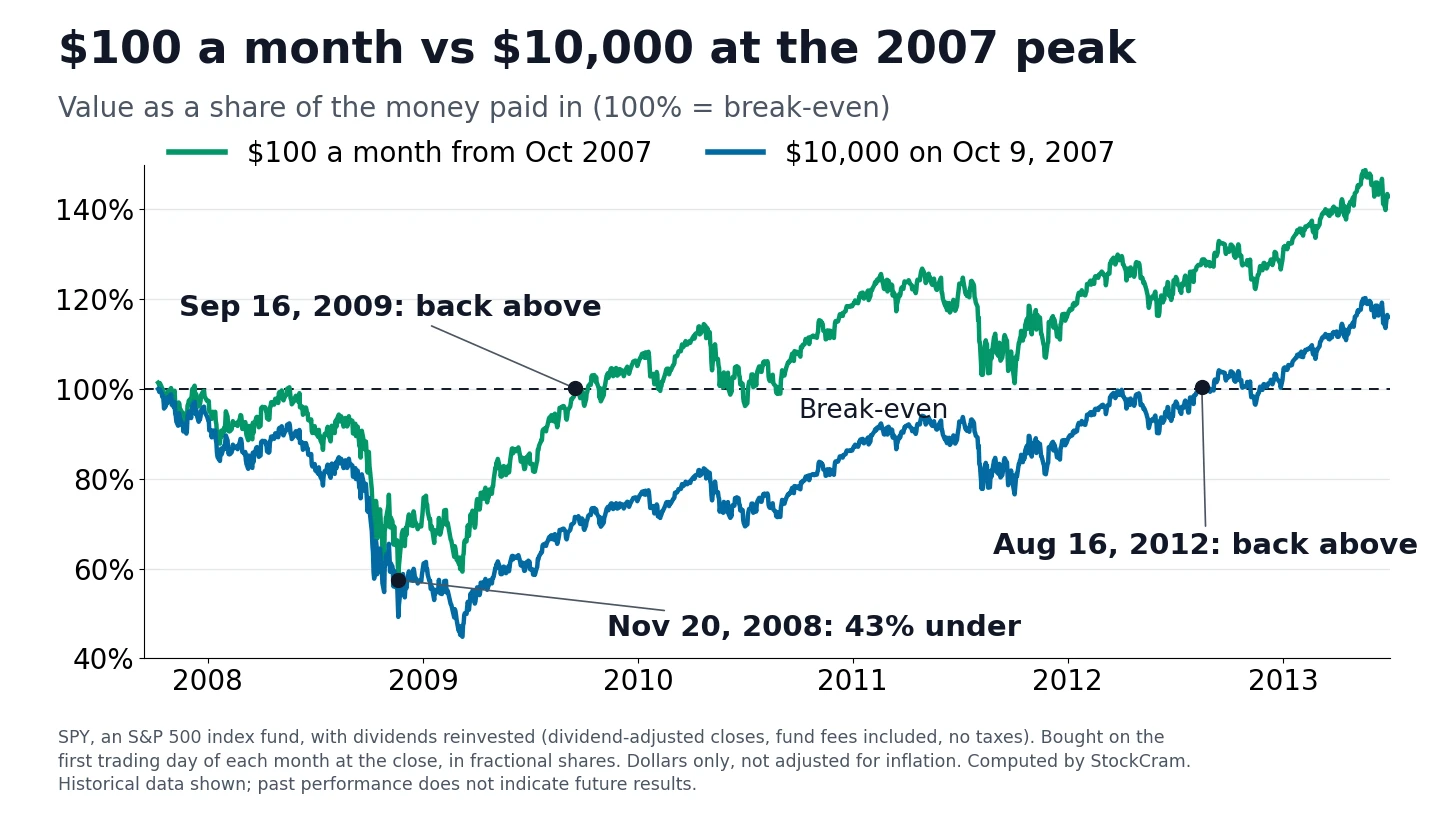
The green line got back almost three years before the blue one. Deposits made after prices fell bought more fund shares for the same $100, so the account needed a smaller rebound to break even. Investing a fixed amount on a schedule like this is called dollar-cost averaging. The comparison is about break-even dates, not about which approach ended with more money: the monthly saver also had far less in the market when it fell. The count is in dollars only and leaves out the inflation the table above adjusts for. It assumes a fixed $100 a month, with the fund's own fees but no taxes. It also depended on the S&P 500 coming back; in a market that stayed down, the result would have been different. Our DCA vs lump sum calculator runs the same test with your own amounts. Past performance does not guarantee future results.
Congress set up the Financial Crisis Inquiry Commission to examine the causes of the 2008 financial crisis, and its members could not agree on one. Its report came out in January 2011. Its six-member majority blamed failures of financial regulation and supervision, failures of risk management at big firms, too much borrowing (known as leverage), collapsing mortgage-lending standards, the credit rating agencies, and the complex bonds and contracts built on those loans. Three commissioners, Keith Hennessey, Douglas Holtz-Eakin and Bill Thomas, wrote a joint dissent that listed ten causes and stressed the global spread of a credit and housing bubble. A fourth, Peter Wallison, wrote his own dissent naming government housing policy as the main cause.
The mechanics are easier to agree on. They ran as a chain, each step setting off the next.
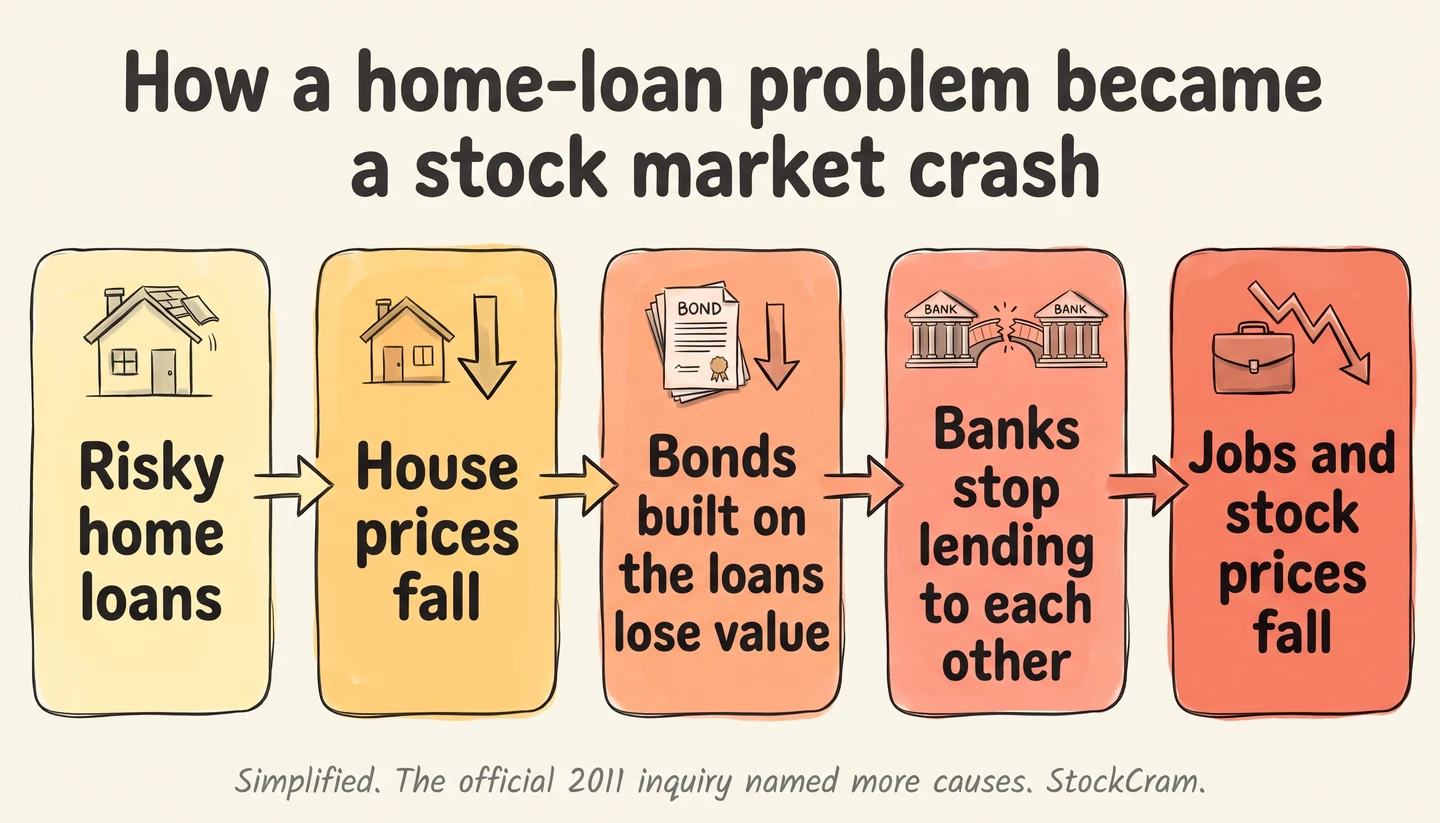
It started with the loans. Mortgage lending standards had weakened, and many US home loans only worked if house prices kept rising or the loan could be refinanced, which became impossible once prices fell. Banks around the world held bonds built from those loans, often with borrowed money. When the bonds fell in value, lenders stopped trusting each other, and money for short-term loans dried up (a loss of liquidity). That is why the failure of one Wall Street investment bank spilled into lending, jobs and stock prices far beyond Wall Street. Our post on whether the housing market is crashing in 2026 compares today's mortgages with those of 2006.
Every figure below comes from the same daily closes as the tables above.
Five and a half years by price, for the S&P 500: from its October 9, 2007 record to March 28, 2013. Counted from the March 2009 low, it took four years. With dividends reinvested it was back in 2012: April 2 for the total-return index, August 16 for SPY.
From the October 2007 record to the March 9, 2009 low, the S&P 500 fell 56.8%. Within calendar 2008 alone it fell 38.5% by price, or about 37% with dividends reinvested.
Almost. The Dow Jones Industrial Average fell 53.8%, from 14,164.53 on October 9, 2007 to 6,547.05 on March 9, 2009. It first closed above its record again on March 5, 2013, three weeks before the S&P 500.
March 9, 2009, for the S&P 500, the Dow and the Nasdaq. The S&P 500 closed at 676.53 that day, its lowest close since September 1996.
Both turned into runs on lenders outside the regular banking system (trust companies in 1907; investment banks and money market funds in 2008), and both drew rescues: one led by the banker J.P. Morgan and backed by Treasury deposits in 1907, government ones in 2008. In 1907 there was no Federal Reserve; the crisis is one reason it was created. Our post on the Panic of 1907 measures that crash the same way.
This page doesn't forecast. What 2008 offers is the record of one severe case: a 57% fall, and a recovery that took from about four to six years, depending on the measure.
Method. Data checked through October 30, 2026. "Recovered" means a closing price above the level being regained, the October 2007 record unless a row says otherwise. It does not mean investors felt whole, kept their purchasing power or avoided taxes and fees. Durations are counted from the starting date in each row and rounded to the nearest month. Figures are price only unless they say dividends. This page is historical education, not investment advice. Historical data shown; past performance does not indicate future results.
Every post in this series measures crashes the same way; our market-history method explains how.
The S&P 500 fell 57% from October 2007 to March 2009
$10,000 at the record was worth $4,322 at the low, by price.
Recovery by price took five and a half years
First close above the 2007 record: March 28, 2013. Four years from the low.
Dividends brought it back in 2012
The total-return index was back on April 2, 2012 and SPY on August 16, 2012; both stayed above from late November 2012.
Stocks fell another 38% after the rescue became law
The rescue became law on October 3, 2008; the low came on March 9, 2009. Past performance does not guarantee future results.
Try the decisions yourself
Play the free 2008 stock market crash simulator: 12 decisions from 2007 to 2009.
The Nasdaq fell 78% after March 2000 and took 15 years to regain its high. The S&P 500 fell 49%, was back by 2007, and has stayed above its 2000 record since 2013.
The Dow fell 89% after 1929 and took 25 years to regain its high by price. With dividends reinvested and deflation counted, the market was briefly back by 1936 and for good by 1949.
On October 19, 1987 the S&P 500 fell 20.47% in a day. What caused it, and when the market recovered: 21 months by price, about 19 with dividends, over 4 years after inflation.