
2008 Stock Market Crash: How Long Did It Take to Recover?
The S&P 500 fell 57% from October 2007 to March 2009. By price it regained its record in March 2013; with dividends, in 2012.
13 min read
Read Article
The S&P 500 fell 34% in 33 days, from February 19 to March 23, 2020, and took about six months to recover: by price, it closed above its record on August 18, 2020.

Educational purposes only. This content does not constitute investment advice. Read our disclaimer
StockCram is not a broker-dealer, investment adviser, or financial institution. All content is for educational and informational purposes only and should not be construed as personalized investment advice. Consult a qualified financial professional before making investment decisions. Past performance does not guarantee future results.
The S&P 500 took about six months to recover from the COVID stock market crash by price. The index of 500 large US companies fell 34% in 33 days, from a record close on February 19, 2020 to its low on March 23, 2020, then closed back above that record on August 18, 2020, five months after the low. With dividends reinvested, it got back on August 10, about a week earlier.
That makes 2020 the fastest fall and the fastest recovery of the six crashes in our Market Rewind series. By price, the 2008 crash took five and a half years to get back and 1929 took about 25. Below are the measures, what caused the fall, the worst days, what happened to people who sold in March, and how 2020 compares with the other five.

Free · pretend money
COVID stock market crash simulator: what would you have done?
12 moments, real S&P 500 closes, about 7 minutes. You only see the news of each day.
Historical simulation with pretend money. Past performance does not indicate future results. Not investment advice.
What would you have done in March 2020? Our free replay starts you in January 2020 with $10,000 in pretend money. At 12 moments, from the first virus warnings to the new record in August, you decide how much stays in the stock market (all of it, half, a quarter or none), knowing only that day's news. The replay ends on December 31, 2020, with the S&P 500 about 15% above its first close of the year, on January 2.
Here, "recovered" means the S&P 500 closed above an earlier level: its February 19, 2020 record, unless a measure says otherwise. Moves during the trading day do not count.
It took the S&P 500 six months to recover from the COVID crash by price: from its February 19, 2020 record of 3,386.15 to its first close above it, 3,389.78, on August 18, 2020. Start the count at the March 23 low instead and it took five months, while the index rose 52%.
That first close back did not hold. Over the next eleven weeks the S&P 500 closed at or below the February record 25 more times, at worst 4.4% below it on September 23. The last of those closes came on November 3, 2020, election day. Through October 30, 2026, the end of our data, it has closed above the record every trading day since, including through the 25% fall of 2022. The chart follows the S&P 500 through 2020: the drop to the March low, the first close back in August, and the dips under the record that fall.
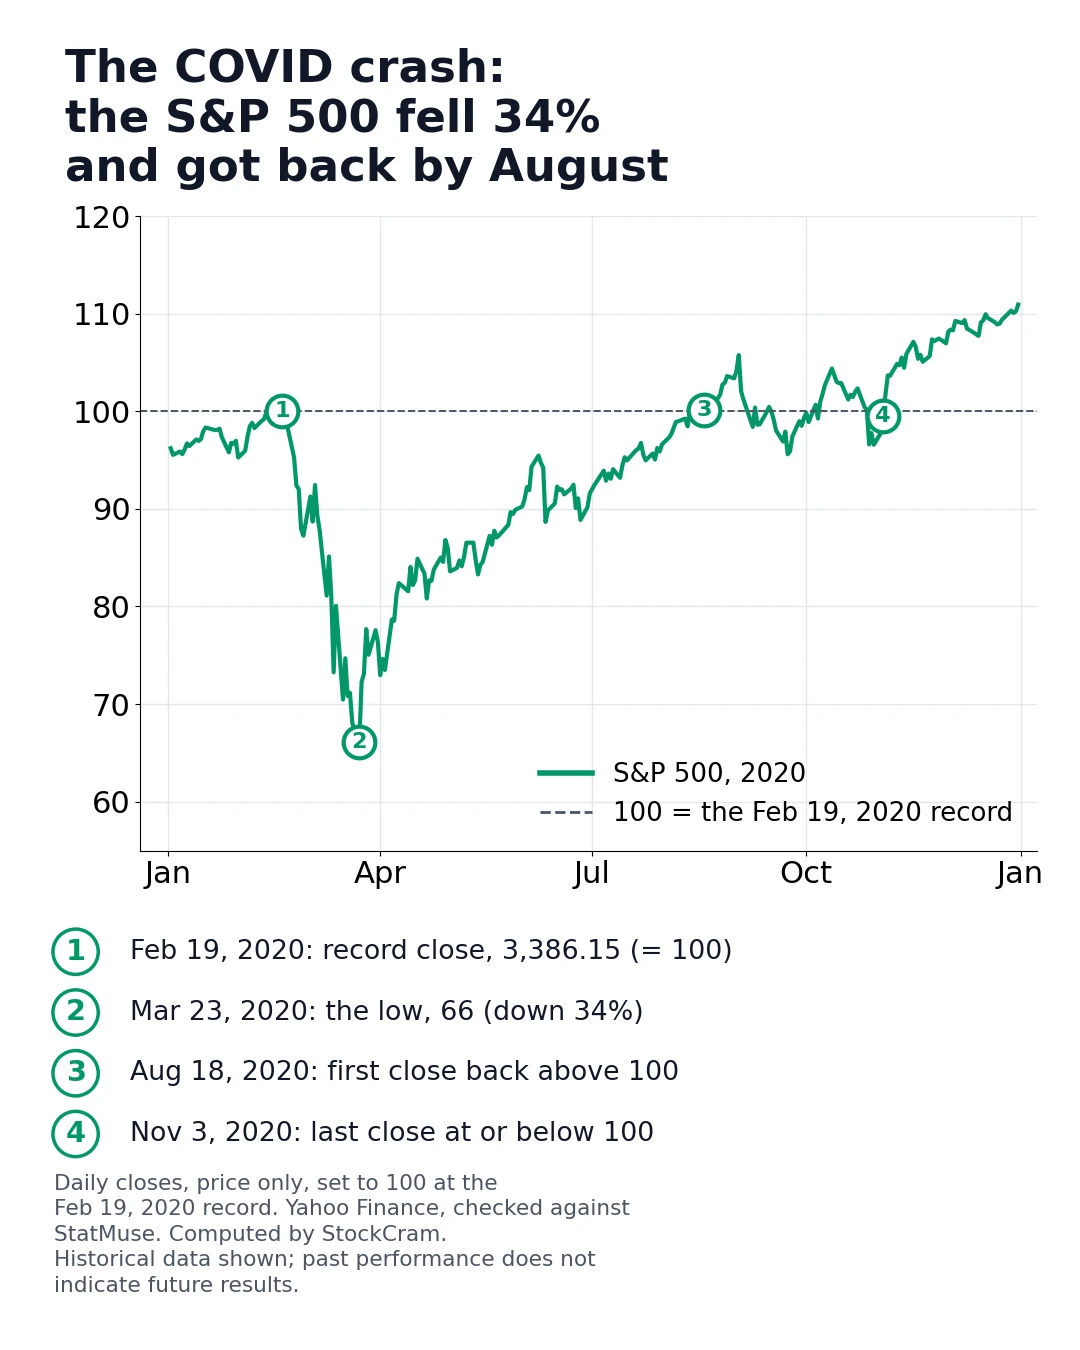
The line in the chart is the price alone. Count the dividends, the cash many companies pay their shareholders, and the wait was about a week shorter. The S&P 500's total-return index, which assumes every dividend is reinvested at no cost, first closed above its February level on August 10, 2020. SPY, the best-known fund that tracks the index, got back the same day. Six months of dividends add up to less than 1% of a fund's value, so here they moved the date by days. After 1929 they cut the wait by about ten years: on the broader S&P composite, from about 25 years by price to about 15 with dividends.
Inflation barely mattered either. Prices of everyday things rose about half a percent between February and August 2020. Adjusted for that (a real return), the S&P 500 by price got back around August 24, 2020, and with dividends around August 12. Both dates are approximate, because the consumer price index, used to measure inflation, is published monthly.
The table puts the measures side by side.
"Back above" is the first close above the S&P 500's February 19, 2020 record in each measure. Times run from the starting date shown. Inflation rows use the monthly consumer price index. The dividend measures closed at or below the record one last time on November 2, 2020, and the price on November 3. Data through October 30, 2026. Historical data shown; past performance does not indicate future results.
| Measure | Starting point | Back above | Time |
|---|---|---|---|
| S&P 500 total-return index, dividends reinvested | Feb 19, 2020 record | Aug 10, 2020 | 5 months 3 weeks |
| S&P 500 index fund (SPY), dividends reinvested | Feb 19, 2020 record | Aug 10, 2020 | 5 months 3 weeks |
| SPY, dividends reinvested, after inflation | Feb 2020 record | about Aug 12, 2020 | about 5 months 3 weeks |
| S&P 500, price | Feb 19, 2020 record | Aug 18, 2020 | 6 months |
| S&P 500, price, after inflation | Feb 2020 record | about Aug 24, 2020 | about 6 months |
| S&P 500, price, from the March 23 low | Mar 23, 2020 low | Aug 18, 2020 (the February record) | 5 months |
| S&P 500, price, above for good | Feb 19, 2020 record | Nov 4, 2020 (every close since) | 8 and a half months |
The S&P 500 fell 33.9% from its February 19 record to its March 23, 2020 close, usually rounded to 34%. $10,000 invested at the record was worth $6,608 at the low. Counting dividends, the fall was 33.8%, almost the same, because five weeks of dividends barely count.
What set 2020 apart was the speed. The index needed six trading days to close 10% below its record, a fall usually called a correction, and 16 to close 20% below it, the usual line for a bear market. In 2008 the first 20% took nine months.
Each row below is the first close past a mark. Some days went past more than one: on March 12 the index went from 19% below the record to 27% below it in a single session.
First close at least that far below the February 19, 2020 record close of 3,386.15, and how many trading days after the record it came. Historical data shown; past performance does not indicate future results.
| Mark | First close past it | S&P 500 close | Below the record | Trading days after the record |
|---|---|---|---|---|
| 10% below the record | Feb 27, 2020 | 2,978.76 | 12.0% | 6 |
| 20% below | Mar 12, 2020 | 2,480.64 | 26.7% | 16 |
| 30% below | Mar 20, 2020 | 2,304.92 | 31.9% | 22 |
| The low | Mar 23, 2020 | 2,237.40 | 33.9% | 23 |
The COVID crash started on Thursday, February 20, 2020, the day after the S&P 500's record close, and ended at the March 23 low. It lasted 33 days from the record to the low, or 23 trading days. The virus was already in the news before stocks fell. On January 30 the World Health Organization declared the outbreak a global health emergency, and the S&P 500 still set its record three weeks later. Then cases jumped in Italy, South Korea and Iran, and in the week of February 24 the index lost 11.5%.
The timeline below runs from that record to the day prices got all the way back. It shows the order of events, not their length: the coral part, the fall, took five weeks, and the green part, the climb back, took five months, though it is drawn shorter.
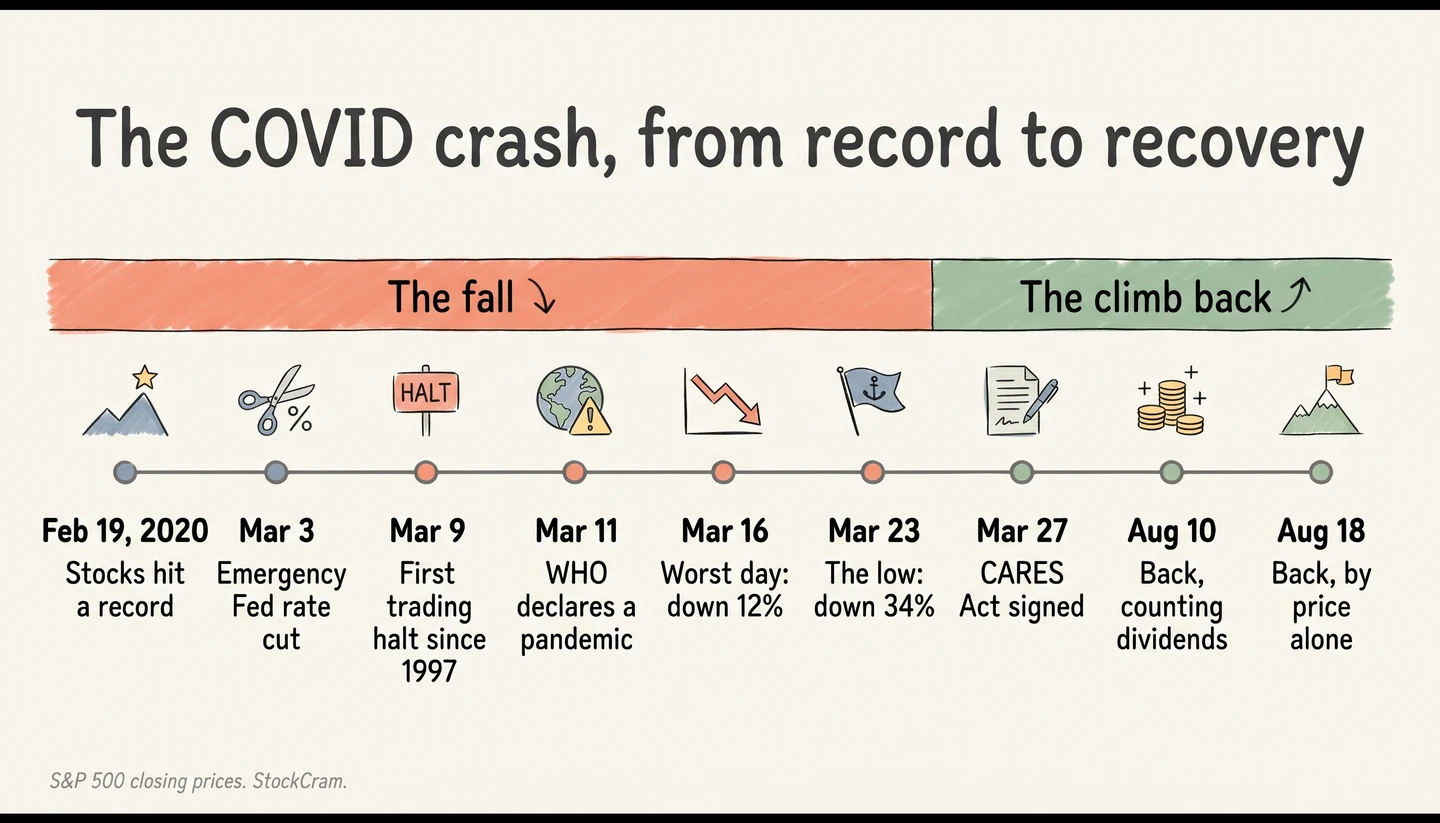
The fall came in fast steps, and each attempt to stop it was followed by another drop. On March 3 the Federal Reserve cut its key interest rate by half a point between its regular meetings. Even so, the S&P 500 closed 2.8% lower that day. On Monday, March 9, the morning after oil prices collapsed when Saudi Arabia announced plans to pump more, the S&P 500 fell 7.6%, enough to set off the market-wide circuit breaker. That is an automatic 15-minute pause in all US stock trading after a 7% fall, and it had not been used since 1997. It stopped trading three more times that month, on March 12, 16 and 18.
The World Health Organization called the outbreak a pandemic on March 11. On Sunday, March 15, the Fed cut its rate to near zero and said it would buy at least $700 billion of government and mortgage bonds. The next day the S&P 500 fell 12%, its worst day of the crash.
The low came on Monday, March 23. That morning the Fed said it would buy those bonds in whatever amounts were needed. Four days later the CARES Act, a federal relief law for households and businesses, was signed. The index has never closed that low since.
The COVID stock market crash was caused by the coronavirus spreading outside China and the shutdowns that followed, which left nobody able to say what companies would earn that year. A share price is a bet on a company's future profits, so when those became a guess, prices fell. Three things made the fall faster: an oil price collapse, a strain that reached even the market for US government bonds, and news that kept getting worse.
No single cause explains the fall, and nobody can measure how much each one mattered. What the record shows is the order: first the virus news, then the oil collapse, then the shutdowns, with the worst day coming the day after the first states closed schools and restaurants.
The worst day of the COVID crash was Monday, March 16, 2020, when the S&P 500 fell 11.98%. Since 1987 only one day has been worse: Black Monday, October 19, 1987, when the index fell 20.47%.
The best days came in the same weeks as the worst. The day after a 9.51% fall on March 12, the index rose 9.29%. The day after the March 23 low, it rose 9.38%. Ten days in 2020 moved 5% or more, up or down, and all but one came between March 9 and April 6. Big swings in both directions are what volatility looks like.
Change from the previous trading day's close. The five biggest losses, then the five biggest gains. Historical data shown; past performance does not indicate future results.
| Date | Change | S&P 500 close |
|---|---|---|
| Mon, Mar 16, 2020 | -11.98% | 2,386.13 |
| Thu, Mar 12, 2020 | -9.51% | 2,480.64 |
| Mon, Mar 9, 2020 | -7.60% | 2,746.56 |
| Thu, Jun 11, 2020 | -5.89% | 3,002.10 |
| Wed, Mar 18, 2020 | -5.18% | 2,398.10 |
| Tue, Mar 24, 2020 | +9.38% | 2,447.33 |
| Fri, Mar 13, 2020 | +9.29% | 2,711.02 |
| Mon, Apr 6, 2020 | +7.03% | 2,663.68 |
| Thu, Mar 26, 2020 | +6.24% | 2,630.07 |
| Tue, Mar 17, 2020 | +6.00% | 2,529.19 |
Yes, by months. When the S&P 500 closed back above its record on August 18, 2020, the latest US unemployment rate, for July, was 10.2%. In February it had been 3.5%. In April it reached 14.8%, the highest in the Bureau of Labor Statistics' monthly figures, which go back to 1948. The next morning The New York Times put it on the front page: “‘This Market Is Nuts’: Stocks Defy a Recession.”
By one measure the recession was already over, though nobody knew it yet. The National Bureau of Economic Research, which dates US recessions, later put it from February to April 2020: two months, ending four months before the S&P 500 got back to its record. It announced that April end on July 19, 2021, almost a year after the record close.
A stock price is what buyers will pay today for a share of a company's profits over many years, so prices move on what investors expect next, not on this month's economy. By late March, the Fed had promised to buy bonds in whatever amounts were needed, and Congress had passed the CARES Act. Those two steps are the reasons usually given for why buyers came back while the news was still bad, though nobody can show what prices would have done without them. The low came while the headlines were still getting worse. Nothing in the news marked it as the bottom.
Selling and buying back are two separate decisions. In 2020 the second one was the harder of the two, because the market turned while the news was getting worse.
The table asks a simple question: if someone sold everything at the close on one of four bad days in March, how many later closes gave them a chance to buy back for less? Someone who sold at the March 16 close, the worst day of the crash, saw only two lower closes afterward: March 20 and March 23. From March 24 on, buying back meant paying more than they had sold for. Someone who sold on March 9 had longer, about six weeks, before prices stayed above their sale price from April 22.
This is not a rule for when to sell or buy, and the opposite lesson was true in 2008. Stocks there fell another 38% after the bank rescue became law, so a sale after the first big drops of 2008 came before far bigger ones. The two crashes looked alike in their first weeks and ended years apart. Trying to pick those days is called market timing, and the two decisions it needs are why it is hard. Our COVID crash replay puts you in those weeks: you make each call with only that day's news, then see how your choices played out. Teachers can use it with a free lesson plan and worksheet.
For a sale at each day's closing price: how far below the February 19 record that was, how many later closes were lower, and the date from which every close stayed above the sale price. Historical data shown; past performance does not indicate future results.
| Sold at the close on | S&P 500 close | Below the record | Later closes that were lower | Above the sale price from |
|---|---|---|---|---|
| Mon, Mar 9, 2020 | 2,746.56 | 18.9% | 21 | Apr 22, 2020 |
| Thu, Mar 12, 2020 | 2,480.64 | 26.7% | 8 | Apr 2, 2020 |
| Mon, Mar 16, 2020 | 2,386.13 | 29.5% | 2 | Mar 24, 2020 |
| Fri, Mar 20, 2020 | 2,304.92 | 31.9% | 1 | Mar 24, 2020 |
The COVID crash was the fastest fall and the fastest recovery of the six crashes in our series. Each one is measured as closely as its records allow: from its peak close to its lowest close, then from the peak to the first close back above it. For 1907, the date back is a monthly figure.
It fell about as far as the 1987 crash (34% against 33.5%) in a third of the time, and got back by price in about a quarter of the time. How far a market fell did not decide how long it took to get back. The dot-com bust and the Panic of 1907 fell by about the same amount, 49% and 48.5%, and took seven years and almost ten years to get back by price.
Each crash had its own causes, so these six cannot say how long the next one will take. What they show is the range. The chart below puts the time to get back by price on one scale, from six months to about 25 years, and the table after it adds how far each market fell and the time with dividends reinvested, which was shorter every time.
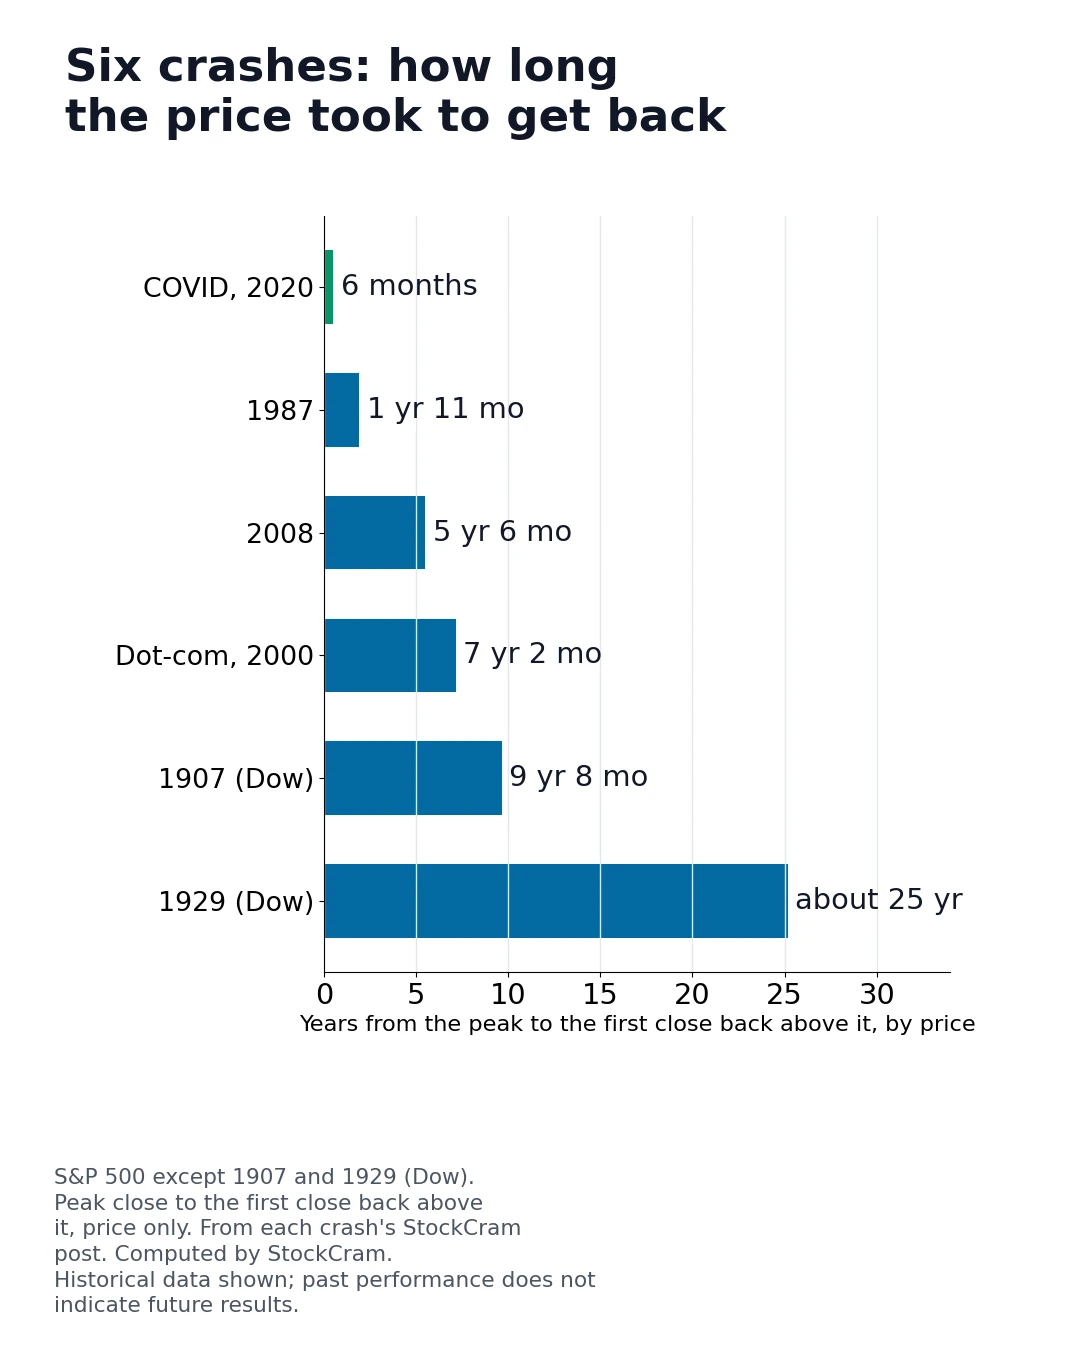
Fall from the peak close to the lowest close; recovery from the peak to the first close back above it. Each crash uses the index its own post leads with: the Dow for 1907 and 1929, before the S&P 500 existed, and the S&P 500 after that. The dividend column comes from each post too: a reconstructed broad-market series for 1907, 1929 and 1987, SPY for the dot-com bust, and the S&P 500 total-return index for 2008 and 2020. The 1907 price date is from monthly figures, not daily closes, and its two recovery columns use different indexes: the Dow by price, the broader S&P composite with dividends. On the composite alone, price took 2 years 11 months, so most of the 1907 gap is the index, not the dividends. For 1929 the composite gives the same price answer as the Dow, about 25 years (September 1954), so there the gap is the dividends. 1907 and the dot-com S&P 500 later fell below their old peaks again; 1987 here counts from the August 25, 1987 record, not from Black Monday. Historical data shown; past performance does not indicate future results.
| Crash | Index | Fall | Peak to low | Back to the peak, by price | With dividends reinvested |
|---|---|---|---|---|---|
| Panic of 1907 | Dow | 48.5% | 22 months | 9 years 8 months (Sep 1915) | 2 years 3 months (S&P composite) |
| 1929 crash | Dow | 89% | 34 months | about 25 years (Nov 23, 1954) | about 15 years |
| Black Monday 1987 | S&P 500 | 33.5% | 3 months | 1 year 11 months (Jul 26, 1989) | about 1 year 9 months |
| Dot-com bust | S&P 500 | 49% | 2 years 6 months | 7 years 2 months (May 30, 2007) | 6 years 7 months |
| 2008 crash | S&P 500 | 57% | 17 months | 5 years 6 months (Mar 28, 2013) | 4 years 6 months |
| COVID crash | S&P 500 | 34% | 33 days | 6 months (Aug 18, 2020) | 5 months 3 weeks |
Every price figure below comes from the same daily closes as the tables above.
About six months by price, for the S&P 500: from its February 19, 2020 record to August 18, 2020. Counted from the March 23 low, it took five months. With dividends reinvested it was back on August 10. It closed below the record a few more times that fall and has stayed above it since November 4, 2020.
The S&P 500 fell 33.9% from its February 19, 2020 record close of 3,386.15 to its March 23 close of 2,237.40. Counting reinvested dividends, the fall was 33.8%. Over the whole of 2020 the index still ended up 16.3% by price, counted from the last close of 2019.
March 23, 2020, at 2,237.40, 23 trading days after the record. That morning the Federal Reserve said it would buy government and mortgage bonds in whatever amounts were needed. It rose 9.38% the next day and has not closed that low since.
No. US stock markets stayed open on every regular trading day of 2020, and the S&P 500 has a closing price for each one. Trading stopped market-wide only four times, for 15 minutes each, when the circuit breaker went off on March 9, 12, 16 and 18. The New York Stock Exchange did close its trading floor because of COVID-19, from March 23, 2020, but trading carried on without it.
Nobody can prove why. The reasons usually given are the Federal Reserve's promise on March 23 to buy bonds in whatever amounts were needed, the CARES Act four days later, and buyers looking past the shutdowns to the profits companies would earn afterward.
It was the fastest of the six crashes in our series. It took the S&P 500 only 16 trading days to close 20% below its record, the usual line for a bear market. In 2008 the same fall took nine months.
A little. Between August 19 and November 3, 2020 the S&P 500 closed at or below its February record 25 times, at worst 4.4% below it on September 23. It never came near the March low. Even in the 25% fall of 2022, its lowest close, 3,577.03 on October 12, 2022, stayed above the February 2020 record.
By price, it was worth $6,608 at the March 23 low, $10,011 on August 18 and $11,092 at the end of 2020. Each figure was a little higher with dividends reinvested. Historical data shown; past performance does not indicate future results.
By price, the S&P 500 closed at 7,580.07 on October 30, 2026, the end of our data. That is 124% above its February 19, 2020 record and 239% above the March 23, 2020 low, and it includes the 25% fall of 2022. $10,000 invested at the February 2020 record would have been worth about $22,386 by price. Historical data shown; past performance does not indicate future results.
No. Each crash had its own causes. In our series the time to get back by price ranged from six months in 2020 to about 25 years after 1929. Nobody can tell in advance which kind a fall will be, which is what our COVID crash replay lets you feel for yourself.
Method. Data checked through October 30, 2026. "Recovered" means a closing price above the level being regained, the February 19, 2020 record unless a row says otherwise. It does not mean investors felt whole or avoided taxes and fees. Durations are counted from the starting date in each row. Figures are price only unless they say dividends. Dates after inflation are approximate, because the consumer price index is published monthly. This page is historical education, not investment advice. Historical data shown; past performance does not indicate future results.
Every post in this series follows the same method, as closely as its records allow; our market-history method explains how.
The S&P 500 fell 34% in 33 days
From February 19 to March 23, 2020: $10,000 at the record was worth $6,608 at the low, by price.
Recovery by price took six months
First close above the February record: August 18, 2020. Above for good from November 4, 2020.
Dividends and inflation barely moved the date
With dividends it was back on August 10; by price after inflation, around August 24.
The fastest of the six crashes in our series
By price, 1987 took 1 year 11 months to get back, 2008 five and a half years and 1929 about 25 years.
Make the 2020 calls yourself
Play the free COVID crash simulator: $10,000 in pretend money and 12 decisions from January to August 2020, using only the news of each day.
The S&P 500 fell 57% from October 2007 to March 2009. By price it regained its record in March 2013; with dividends, in 2012.
On October 19, 1987 the S&P 500 fell 20.47% in a day. What caused it, and when the market recovered: 21 months by price, about 19 with dividends, over 4 years after inflation.
The Nasdaq fell 78% after March 2000 and took 15 years to regain its high. The S&P 500 fell 49%, was back by 2007, and has stayed above its 2000 record since 2013.