Why the Fed Might Raise Rates in September 2026 After Markets Expected Cuts

The Federal Reserve's September 2026 meeting has markets on edge. Despite year-over-year inflation appearing stable, Fed Chairman Kevin Warsh's Jackson Hole speech shifted rate hike odds to nearly 50-50. The disconnect isn't about what the data shows, it's about which data the Fed prioritizes and how recent monthly trends can tell a completely different story than the annual numbers making headlines.

Sean Sha
By Sean Sha(updated )17 min read

Educational purposes only. This content does not constitute investment advice. Read our disclaimer

StockCram is not a broker-dealer, investment adviser, or financial institution. All content is for educational and informational purposes only and should not be construed as personalized investment advice. Consult a qualified financial professional before making investment decisions. Past performance does not guarantee future results.
Why the Fed Might Raise Rates in September 2026 After Markets Expected Cuts
Share
17 min read

The Federal Reserve might raise interest rates at its September 15-16, 2026 FOMC meeting, even though inflation appears to be holding steady. That sentence probably sounds backward if you have been following financial news this year. At the start of 2026, most forecasters expected at least one rate cut. As of September 6, CME FedWatch puts a 25 basis point hike at roughly 70%, up from 60% on August 31 and 39.9% on August 21. Barclays has moved its house call to hikes in September and December.

Updated September 12, 2026. The August employment report showed 162,000 jobs added on September 4. PPI on September 10 showed producer prices up 5.4% annually with core at 0.2% monthly. CPI on September 11 showed headline inflation at 3.4% annually with core at 0.3% monthly. The FOMC decision is September 16.

Year-over-year PCE inflation held at 3.7% in July, which reads as stable. Fed Chairman Kevin Warsh spent his Jackson Hole keynote pointing at a different number from the same index: the six-month change, running at 4.1%. Two measurements of the same prices, disagreeing about direction.

What Changed Between July and September 2026

Update (September 12, 2026): Both remaining data releases landed. PPI on September 10 showed August producer prices up 0.4% monthly and 5.4% annually, with core PPI rising 0.2%, below the 0.3% forecast. CPI on September 11 showed August headline inflation at 3.4% annually, matching expectations, but core CPI rose 0.3% monthly, above the 0.2% consensus. CME FedWatch hike odds stand at roughly 66% as of September 12. The FOMC announces its decision on September 16 at 2:00 PM ET, four days from now.

Update (September 6, 2026): The August employment report landed on September 4, showing 162,000 jobs added against a consensus of 53,000, with unemployment holding at 4.1%. July was revised from a loss of 23,000 to a gain of 21,000. CME FedWatch hike odds rose from roughly 60% on August 31 to approximately 70% by September 3, while Kalshi moved to 53%.

In March 2026, the median FOMC projection still implied a rate cut before year end. By the June 17 meeting that had already flipped: the median end-2026 federal funds rate moved to 3.8% from 3.4%, and nine of eighteen officials projected at least one hike, even as the committee held rates steady. What changed at Jackson Hole was not the direction, it was how convinced markets became about September. The dot plot had been pointing up for two months.

The July 28-29 FOMC meeting held rates at 3.5% to 3.75%, but the vote was 9-3. Beth Hammack of Cleveland, Neel Kashkari of Minneapolis and Lorie Logan of Dallas each dissented in favour of an immediate 25 basis point hike. By the St. Louis Fed's record of FOMC dissents, no chair since Arthur Burns in 1970 has drawn that much opposition this early in a tenure.

On August 26, the Bureau of Economic Analysis released July PCE. The price index rose 0.2% for the month and 3.7% over 12 months, a tenth above the 3.6% forecast. Core PCE, which excludes food and energy, rose 0.2% monthly and 3.3% annually. Both matched expectations, and both marked a third straight month at or above 3.3%.

Then came Jackson Hole. Warsh delivered his keynote on August 28 and the tone was unmistakably hawkish. No new inflation data arrived with it; the July PCE report was already two days old. What changed was how he framed the numbers that were already on the table.

The two places you can watch that repricing disagree, and the gap is worth understanding. CME FedWatch derives probabilities from fed funds futures, where a hike moved from 39.9% on August 21 to about 56% the day after the speech, roughly 60% by August 31, and approximately 70% by September 3. Kalshi runs an event contract on the same meeting, and it moved from about 30% to 47% after Jackson Hole, then to roughly 53% by early September. Futures-implied odds and prediction-market prices are built differently and are not measuring quite the same thing, so a spread between them is normal rather than an error.

Date Event Hike odds, CME FedWatch Hike odds, Kalshi August 21, 2026 A week before Jackson Hole 39.9% not quoted August 27, 2026 Day before the keynote ~35% ~30% August 28, 2026 After Warsh's Jackson Hole keynote ~56% ~47% August 31, 2026 Barclays moves to two hikes in 2026 ~60% not quoted September 4, 2026 August jobs report: 162,000 added vs. 53,000 expected ~70% ~53% September 10, 2026 August PPI: +0.4% monthly, +5.4% annually; core +0.2% ~66% not quoted September 11, 2026 August CPI: +3.4% annually (as expected); core +0.3% monthly ~66% not quoted

Market-implied probability of a 25 basis point hike at the September 15-16 FOMC meeting. Sources: CME Group, Kalshi, Reuters. Market-implied odds measure expectations, not outcomes.

Year-over-year inflation held at 3.7% in both June and July 2026. Read only the headline and inflation looks stuck but stable, the sort of reading a soft landing is supposed to produce. The Fed does not stop there.

Warsh put the gap in his own words at Jackson Hole: "The Fed's preferred measure of inflation, the 12-month change in the PCE price index, stands at 3.7 percent, while the six-month change is 4.1 percent." A six-month rate above the twelve-month rate says the recent pace is worse than the annual figure, not better. That single comparison is why the conversation changed.

The mechanism connecting the two, and why a central bank answers rising prices with higher rates at all, is the subject of inflation, rate hikes and cuts. Year-over-year inflation compares prices today with prices exactly 12 months ago. Everything in between, good months and bad, gets averaged together. If inflation was high a year ago and is high today, the annual number can sit flat while the recent trend accelerates underneath it.

Weight loss is the intuition. You step on the scale and compare with a year ago: down five pounds, so the annual trend looks fine. But if you have put on three pounds in the last month, the recent direction is wrong, and that is the part that should change what you do next.

Warsh gave a second version of the same point that has nothing to do with averages. Over the past 12 months, he said, 54 percent of the goods and services in the PCE basket rose more than 3 percent. Over the past six months, annualised, 49 percent did. Inflation concentrated in a handful of categories is more consistent with a sector-specific or supply shock. Inflation above 3 percent across roughly half of what people buy is harder to describe that way.

KPMG's read on the July data was that core inflation is not moving decisively lower, but grinding sideways at a pace too hot for comfort.

Measure Reading What it says PCE price index, 12-month change 3.7% The headline, unchanged from June PCE price index, 6-month change 4.1% Recent pace running above the annual figure Share of PCE basket above 3%, 12 months 54% Breadth, not a few outlier categories Share of PCE basket above 3%, 6 months annualised 49% Breadth has barely narrowed The Fed's target 2.0% Headline PCE, not core, not CPI

All figures as cited by Chairman Warsh in his Jackson Hole keynote, August 28, 2026. Source: Federal Reserve.

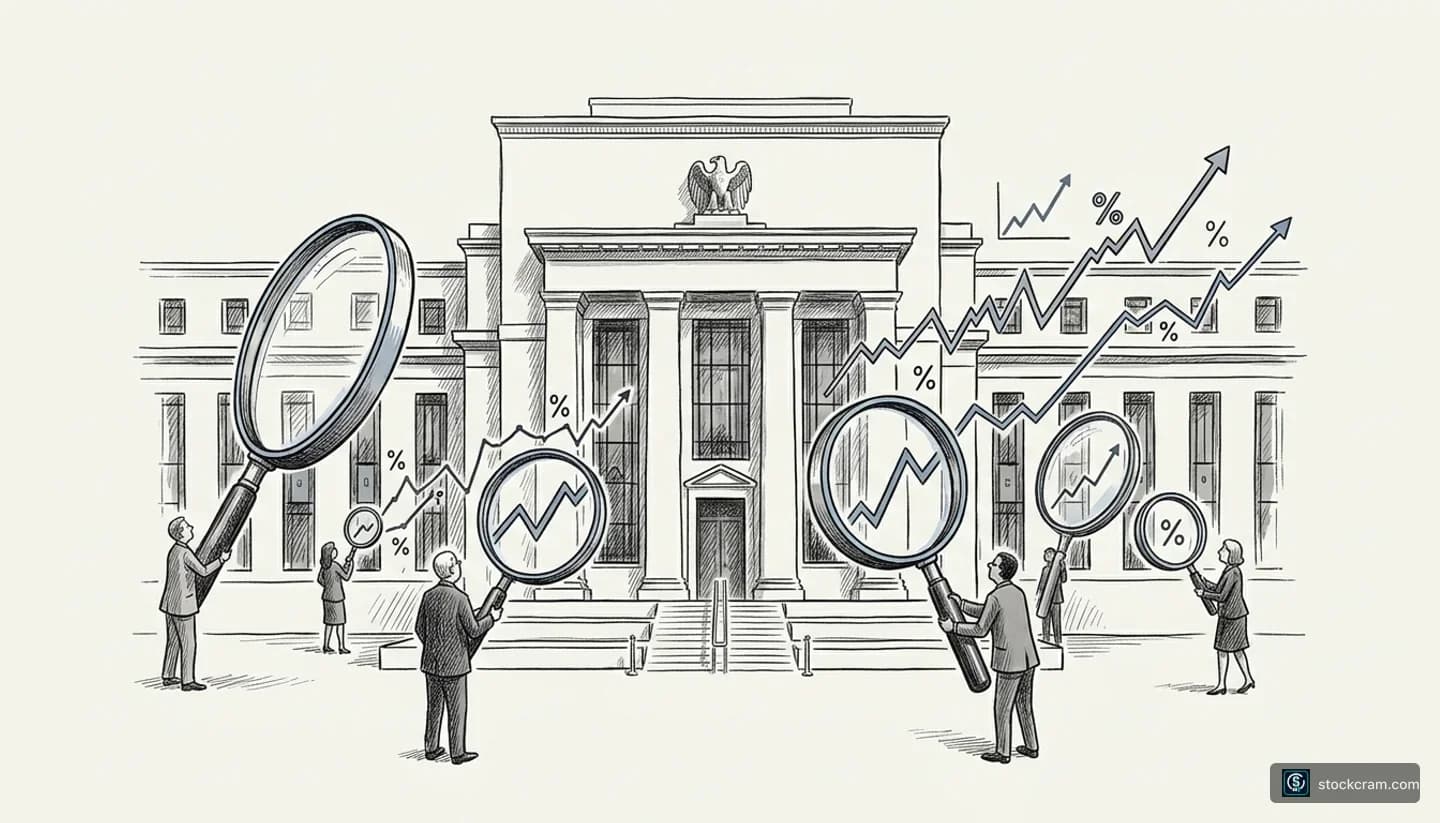
Two trend lines diverging in front of the Federal Reserve building: a flat line at 3.7 percent and a steeper rising line at 4.1 percent.
Figure: the 12-month PCE change (3.7%) against the six-month change (4.1%), the comparison Warsh drew at Jackson Hole.

Why PCE Matters More Than CPI to the Federal Reserve

You have probably heard more about the Consumer Price Index than the Personal Consumption Expenditures price index. CPI is released earlier in the month and has been around longer, so it gets the coverage. But the Fed's 2% target is written against PCE.

The two are built differently. PCE covers a broader universe of spending, including consumption paid for on a household's behalf, such as the share of medical care funded by an employer or by Medicare. CPI is narrower and focuses on what households pay directly out of pocket.

They also weight things differently. PCE's expenditure weights shift more readily as spending patterns change, so it responds faster when people trade down. CPI updates its weights too, and its methodology does account for some substitution, but it works within a more fixed structure. Neither index is more accurate than the other. They answer slightly different questions, and the Fed chose the one with broader coverage.

Housing is the other significant gap. CPI gives shelter a much heavier weight than PCE does, which makes CPI swing harder when rents move quickly. That weighting is also why CPI and PCE can tell different stories in a year when housing costs are the moving part.

Core inflation strips out food and energy. Not because those prices do not matter to households, which they obviously do, but because energy moves on geopolitics and food on weather and global supply chains, and both swing hard month to month. Removing them helps policymakers see the underlying inflation trend without that noise. It does not mean the excluded prices are beyond the reach of policy.

July 2026 is a good illustration of why you should not assume one gauge tracks the other. Headline CPI came in at 3.4% year over year and core CPI at 2.5%, released August 12. Headline PCE was 3.7% and core PCE 3.3%, released August 26. In this particular month, CPI read cooler than PCE, not hotter. The two indexes have historically diverged in both directions, and the size of the gap changes from month to month.

Measure What it tracks July 2026, 12-month Released Headline PCE All consumer spending, broad coverage 3.7% August 26 (BEA) Core PCE PCE excluding food and energy 3.3% August 26 (BEA) Headline CPI Direct household out-of-pocket spending 3.4% August 12 (BLS) Core CPI CPI excluding food and energy 2.5% August 12 (BLS)

Sources: Bureau of Economic Analysis, Bureau of Labor Statistics. The Fed's 2% target refers to headline PCE.

The distinction matters for what your money actually buys: purchasing power erodes at whichever rate is real, not whichever gauge is quoted. When Warsh says inflation is too high, PCE is the number he means. Worth remembering the next time a CPI print moves markets and the Fed appears not to react.

The Measure That Argues the Other Way

Not every gauge argues for a hike, and the most interesting one argues against. Trimmed mean PCE, published by the Dallas Fed, discards the largest price increases and decreases each month and reads what is left. Over the 12 months ending in July it was 2.3 percent, against 3.7% headline and 3.3% core.

That is close to target, and it is the strongest argument for holding in September. There is a catch. An alternative version of the trimmed mean, calibrated over a longer sample, runs hotter and stood at 2.6% for the 12 months ended in June. Different calibrations diverge most when the distribution of price changes is skewed, which is the current situation.

Supercore services, core services excluding shelter, rose 0.3% in July. It is often described as a wage-inflation measure, which overstates what it does. It is an attempt to isolate the more persistent part of services inflation by removing the two components that move on something other than domestic demand.

The measures disagree with each other. That is why Warsh framed the bar as confidence in the trend rather than a single number clearing a threshold.

Measure July 2026 (12-month) What It Shows Why the Fed Watches It Headline PCE 3.7% Total consumer inflation The official target measure Core PCE 3.3% Inflation excluding food and energy Less volatile month to month Trimmed Mean PCE 2.3% Central trend, outliers removed Reveals underlying persistence Supercore PCE 3.9% Core services excluding shelter The more persistent services component Alternative Trimmed Mean ~2.6% (June) Longer-sample calibration May better capture recent skew

Sources: Bureau of Economic Analysis, Dallas Fed, KPMG. Different measures highlight different aspects of inflation and are read together.

What Warsh Actually Said at Jackson Hole

Kevin Warsh's August 28, 2026 keynote was his first Jackson Hole address as chairman. Markets wanted his reaction function, the conditions that would trigger a move. They did not get one. If the machinery behind that decision is unfamiliar, how the Fed sets rates covers it from the beginning.

Titled "In Our Time," the speech read closer to a statement of governance than a monetary policy signal. On the outline of his approach: "You can call it an outline, you can call it a trail map, just don't call it forward guidance," a practice he said "has overstayed its welcome." Forward guidance, telegraphing future moves to markets, has been a fixture of Fed communication since 2008. Dropping it returns the Fed to a pre-crisis style in which markets are left to read the data themselves.

On inflation he was direct. "While this summer's [inflation] readings were better than expected, they do not tell me that underlying trends have meaningfully improved," he said. That sentence is what moved the odds. He called July PCE at 3.7% concerning, and described 2% PCE as the firm, fixed target.

Three other passages matter as much as the inflation lines, because they are what make a hike arguable rather than merely hawkish talk.

On the current stance of policy: "I would be hard pressed to describe broad financial conditions as restrictive," pointing to credit spreads near historical lows and bank lending standards on the easier end of their range. A Fed that does not believe current policy is holding the economy back has less reason to wait before tightening further.

On employment: "I believe the labor markets are consistent with full employment." The Fed has a dual mandate, price stability and maximum employment, and it has to serve both with one instrument. When the employment half looks satisfied, the inflation half carries the weight.

On expectations, cutting the other way: medium-term inflation expectations "by and large, look stable" and "right now they are well anchored." Anchored expectations are what let a central bank wait out a price shock instead of tightening into it. That is the strongest reason in his own speech to be patient, and it is why the September decision is contested rather than settled, even with the odds now leaning toward a hike.

He also drew a line about the Fed's role in markets. "We should not indulge a regime in which market participants are looking primarily to the Fed for their next trade," he said, reflecting a view that prices should be driven by fundamentals rather than central-bank signals. For background on why rate decisions are structured to sit apart from short-term political and market pressure, see Fed independence.

He did not rule out a September hike and did not commit to one. No thresholds, no timeline. Markets are left to do their own analysis, which appears to be the point. If the institution itself is unfamiliar, what the Federal Reserve is starts from zero.

The Federal Reserve building with diverging directional signals showing the tension between cutting and hiking rates, while recent data trends point upward despite stable headline numbers.
Figure: What Warsh Actually Said at Jackson Hole

The Iran Conflict, Energy Prices, and Supply Shocks

There is an energy component to the 2026 inflation problem. A conflict involving Israel and Iran disrupted shipping through the Strait of Hormuz earlier in the year, and oil ran from around $80 a barrel toward $120 at the peak. An oil shock reaches consumer prices through freight, packaging and utilities long after the headline barrel price has moved. We covered that chain in detail in oil prices during war.

Central banks typically look through temporary supply shocks by focusing on core inflation, which excludes energy. The reasoning is simple: the Fed cannot drill for oil or settle a conflict, and raising rates does not add a barrel of supply.

The limit is duration. If energy prices stay high long enough, they stop being a line item and start shaping expectations. Workers ask for wages that cover the pump. Businesses price in shipping. A shock becomes a trend, and the risk the Fed actually fears is stagflation: prices climbing while growth slows, which leaves no comfortable move.

Warsh's own read is that this has not happened: medium-term inflation expectations, he said at Jackson Hole, still look stable and well anchored. The concern is prospective rather than realised. A prolonged disruption to Middle East oil supply would raise the cost of goods and services that use it as an input, on top of the direct effect on headline inflation, and would keep the skew of price changes tilted upward.

What a Hike Would Change, Mechanically

A 25 basis point hike would move the federal funds rate to 3.75% to 4.00%.

The mechanics are the same in every hiking cycle. Higher rates raise the discount rate applied to future profits, which weighs most on growth stocks whose earnings sit years away. Newly issued bonds pay more, which makes existing lower-coupon bonds worth less and gives income investors an alternative to dividend payers; stocks versus bonds covers why that tradeoff shifts with rates. For banks, higher rates can increase what they earn on loans, but whether profits improve depends on how quickly deposit costs follow, how fast assets reprice, and what the yield curve does. Higher short-term rates can squeeze a bank as easily as help it.

We walk through why the textbook mechanics do not always show up in share prices in why stocks go up when interest rates are high, and how rates affect markets takes the same ground more slowly.

How markets take it depends less on the hike than on what comes with it. A move paired with language suggesting the tightening is finished reads very differently from the same move paired with a warning of more. And a decision that is already largely priced in usually draws a smaller reaction than a genuine surprise, though positioning, guidance and the projections released alongside it can still move prices on a fully expected outcome.

What to Watch Before September 16

Three data releases landed before the decision. All three are now in.

Date Release Why it matters Result September 4 August employment situation (BLS) Warsh called the labor market consistent with full employment; a rising unemployment rate would undercut that 162,000 jobs added (vs. 53,000 expected), unemployment 4.1% September 10 Producer Price Index (BLS) Pipeline costs, an early read on where consumer prices head next +0.4% monthly, +5.4% annually; core +0.2% (below 0.3% forecast) September 11 Consumer Price Index (BLS) The last major inflation print before the meeting +3.4% annually (matched forecast); core +0.3% monthly (above 0.2% forecast) September 16 FOMC decision (Federal Reserve) Statement at 2:00pm ET, projections the same afternoon, press conference at 2:30 Pending

On the day itself, three things carry the information, and understanding Fed announcements walks through how to read each of them. The statement shows whether the target range moved. The dot plot shows where each official expects rates to end the year, which tells you more than the single decision does. And the press conference is where Warsh either repeats that he is committed to a discipline rather than a decision, or does not.

The underlying data is public and free. PCE inflation comes from the Bureau of Economic Analysis on its published monthly calendar rather than a fixed weekday: July's release was Wednesday, August 26, and the next is Wednesday, September 30, after the meeting. The Dallas Fed publishes trimmed mean PCE the same day. CME's FedWatch shows market-implied odds, which measure expectation rather than forecast. Roughly 60% means the market leans toward a hike without being confident of one, not that a hike is coming.

StockCram is not affiliated with any of these institutions. They are public data sources.

Frequently Asked Questions

Common questions about the Fed's September 2026 decision and how to read inflation data.

Year-over-year inflation and recent inflation can point in opposite directions, and the Fed weights the recent one more heavily. July 2026 PCE held at 3.7% over 12 months, unchanged from June. Measured over six months, the same index was running at 4.1%. A flat annual figure can hide an accelerating recent trend when the period it is being compared against was also high. Warsh made that exact comparison in his Jackson Hole keynote, and it is the core of the case for a hike.

PCE covers a broader slice of spending than CPI, including consumption paid for on a household's behalf, such as medical care funded by an employer or by Medicare. CPI focuses on what households pay directly out of pocket. PCE's expenditure weights also shift more readily as spending patterns change, while CPI works within a more fixed structure, though it does update weights and account for some substitution. CPI gives shelter a much heavier weight, which makes it swing harder when rents move. Neither is more accurate; they answer different questions. The gap between them varies month to month and in both directions. In July 2026, headline CPI was 3.4% against headline PCE at 3.7%. The Fed's 2% target refers to PCE. Our glossary entries for CPI and core inflation cover each measure on its own.

You cannot know, but you can watch the same inputs. PCE inflation comes from the Bureau of Economic Analysis on its published monthly release calendar. CPI, PPI and the employment situation come from the Bureau of Labor Statistics on theirs. Both agencies post their dates a year in advance. Speeches from the chairman and voting members signal how officials are reading that data. CME FedWatch and prediction markets such as Kalshi show market-implied probabilities, which disagreed by nine points at the end of August 2026: roughly 56% against 47%. The quarterly projections show where officials expect rates to end the year. All of it moves. Officials do not pre-commit, and a single print in the week before a meeting can shift the balance.

Rate hikes reach different parts of the market differently. Growth companies whose profits sit years out get discounted more heavily as rates rise. Dividend payers compete with bonds for income investors, and higher yields make that competition harder. Banks can earn more on loans, though whether that improves profit depends on deposit costs and the shape of the yield curve. The larger factor is usually surprise: a hike markets had already priced in moves them less than the guidance that arrives with it. Past performance does not indicate future results.

There is no single pattern. The 2022-2023 cycle raised the federal funds rate by more than five percentage points in roughly 16 months and coincided with a bear market in stocks and the worst year for the US bond market in decades; understanding risk covers why that pairing surprised so many people. The 2004-2006 cycle raised rates by 4.25 points over two years, and the S&P 500 rose across that span. The 2015-2018 cycle moved slower still and also overlapped with rising equity prices. What differed was rarely the hikes themselves; it was the pace, the starting valuations, and whether earnings were growing at the same time. These are descriptions of what happened, not forecasts. Past performance does not indicate future results.

The federal funds rate is what banks charge each other for overnight lending, and it is the only rate the Fed sets directly. Everything you actually pay sits downstream of it. Credit card APRs track the prime rate, which moves almost immediately with the Fed. Mortgage rates track long-term Treasury yields, which respond to expected inflation and growth as much as to the Fed, so they can fall in a month the Fed hikes; how yields affect mortgages walks through that gap. Savings rates move up more slowly than loan rates, because banks are not competing as hard for deposits as borrowers are for credit.

The Bottom Line

Headline PCE at 3.7% looks stable. The six-month rate at 4.1%, with price increases above 3% across roughly half the basket, does not. Both descriptions come from the same index, and the Fed is weighting the second one.

Warsh's refusal to offer forward guidance means the September decision will be argued from public data rather than trailed in advance. The energy backdrop adds to the uncertainty: prices have eased from the May peak, but a renewed disruption in the Strait of Hormuz would make the supply shock harder to look through the longer it ran. The August employment report showed 162,000 jobs added on September 4, well above the 53,000 consensus, with unemployment holding at 4.1%. July was revised upward from a loss of 23,000 to a gain of 21,000. The PPI report on September 10 showed August producer prices up 0.4% monthly and 5.4% annually, with core PPI rising 0.2%, below the 0.3% consensus. The CPI report on September 11 showed August headline inflation at 3.4% annually, matching expectations, but core CPI rose 0.3% monthly, above the 0.2% forecast. Both reports are free to read from the Bureau of Labor Statistics.

Work through how the Fed sets rates and how those decisions reach markets in the StockCram Fed course. If bonds are the part that is unclear, what bonds are and bond yields cover the channel rates travel through, and Foundations starts further back.

Key Takeaways

Warsh's case rests on one comparison: PCE inflation was 3.7% over 12 months but 4.1% over six. The recent pace is running above the annual headline.

The Fed targets 2% PCE, not CPI. In July 2026, CPI read cooler than PCE (3.4% against 3.7%), a reminder that the two do not track each other.

Trimmed mean PCE at 2.3% is the strongest argument for holding, which is why the decision is contested rather than settled even with the odds leaning toward a hike.

Warsh said financial conditions are hard to describe as restrictive and that the labor market is consistent with full employment. Both leave room for a hike.

The three key releases before the decision have all landed: August jobs on September 4 (162,000 added), PPI on September 10 (5.4% annually), and CPI on September 11 (3.4% annually, core 0.3% monthly).

Enjoyed this article?

Share

Related Articles

Read Why Did Gold Jump After Treasury Expanded Bond Buybacks?

Why Did Gold Jump After Treasury Expanded Bond Buybacks?

Gold rose roughly 4% in a single session after the U.S. Treasury unexpectedly doubled its bond buyback program on August 19, 2026. Then yields reversed and gold kept climbing anyway. This explains the links between buybacks, yields, the dollar and gold prices, and what the surprise timing did and did not tell us about fiscal credibility.

25 min read
Read Article