
Market Analysis
Markets This Week: Oil Spike, Tech Selloff
Read Article
Market Analysis
AI-powered insights into global financial markets
 StockCram Editorial11 min read
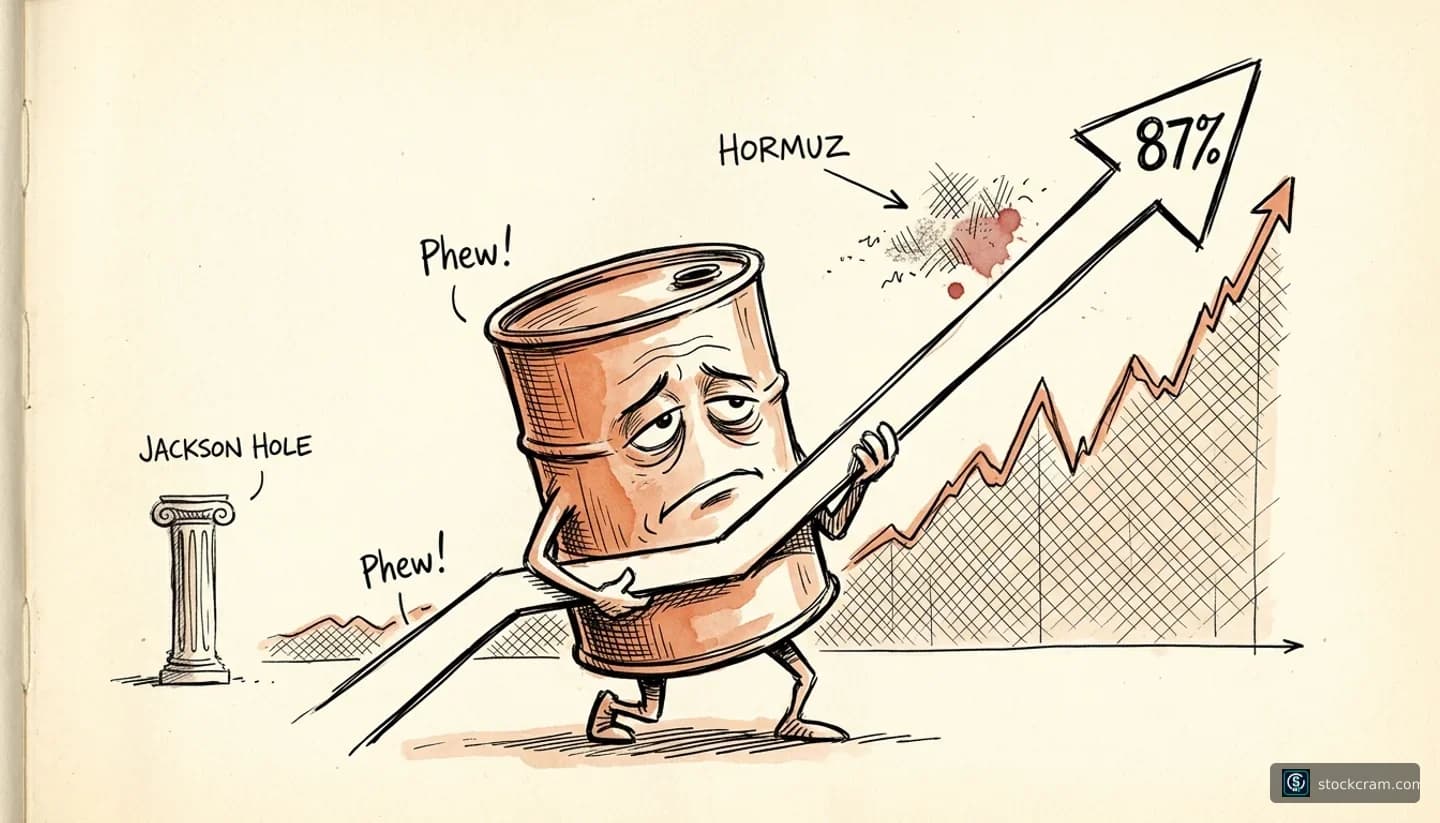
Oil near $87, Fed Chair Warsh's Jackson Hole debut, and a preliminary jobs revision that could rewrite the employment story — the week that tests whether inflation or slowdown wins.
Week of Monday, August 24, 2026 - Friday, August 28, 2026
15.13
-5.50%
4.74%%
+0.89%
$$86.64
+5.15%
$$4,680
+5.0% (approximate)
98.77
-0.05%
Markets closed Friday with the S&P 500 at 7,674.37, up 0.43%, recovering from a week marked by rising Treasury yields and geopolitical uncertainty. The VIX fell 5.50% to 15.13, while WTI crude oil held near $86.64 amid ongoing disruptions in the Strait of Hormuz. A five-month U.S.-Iran conflict has severely restricted traffic through the critical shipping lane, contributing to elevated energy prices and complicating the Federal Reserve's inflation calculus heading into the Jackson Hole symposium.
The S&P 500 closed at 7,674.37 on Friday, August 21, down 1.4% for the week. The Nasdaq Composite settled at 26,180.46, while the Dow Jones Industrial Average finished at 53,277.01. The index sits below its mid-August record of 7,816.70.
The Jackson Hole Economic Policy Symposium has historically served as a venue where Fed chairs signal major policy shifts. Past keynotes have moved markets significantly, from the 2020 framework change to labor market pivots in subsequent years. Additionally, annual payroll benchmark revisions have in the past reshaped perceptions of job market momentum, sometimes by hundreds of thousands of jobs.
Light economic calendar with Chicago Fed National Activity Index for July. Markets may focus on positioning ahead of Wednesday's key data releases.
Consumer Confidence Index provides insight into household sentiment. Attention begins to shift toward Wednesday's inflation and GDP data.
The week's busiest day features PCE inflation data (the Fed's preferred gauge) and the second estimate of Q2 GDP, both at 8:30 AM ET. Nvidia reports earnings after the close, a major event for technology sector investors.
Jackson Hole symposium begins. The BLS releases its preliminary annual payroll benchmark revision at 10:00 AM ET, which could reshape perceptions of labor market strength. Initial jobless claims also released. Best Buy and Dollar Tree report earnings before the open.
Fed Chair Kevin Warsh delivers his first Jackson Hole keynote address, the week's most anticipated event for monetary policy watchers. The symposium continues through Saturday.
Ongoing since February 28, 2026
Periodic Iranian attacks on shipping and retaliatory U.S. strikes have severely disrupted traffic through the Strait of Hormuz for five months. Iran closed the strait in response to U.S.-Israeli airstrikes, and while a June memorandum of understanding briefly increased crossings, subsequent attacks in July reduced traffic again. As of early August, conflict has abated amid Iran-Oman talks, but the situation remains fluid with low shipping volumes.
Market Relevance
Historically, disruptions to the Strait of Hormuz—through which about 25% of the world's seaborne oil trade passed before the conflict—have driven energy prices higher and contributed to inflationary pressures. The current situation has pushed U.S. gas prices up nearly $1 from a year ago to an average of $4.11, according to recent reports. Markets have historically reacted to energy supply shocks with increased volatility in both equity and commodity markets.
Yes. While talks between Iran and Oman continue, the conflict remains unresolved, and traffic through the strait remains well below pre-conflict levels. Any escalation or de-escalation could significantly impact oil prices and broader market sentiment.
The Personal Consumption Expenditures (PCE) price index is the Federal Reserve's preferred measure of inflation. This report includes both headline and core PCE readings for July, along with data on personal income and consumer spending. The core PCE price index, which excludes food and energy, is closely watched by the Fed as it conducts monetary policy.
Markets have historically reacted to PCE data based on how it aligns with or deviates from the Fed's 2% inflation target. Throughout 2025 and 2026, core PCE has run above 2%, contributing to expectations that the Fed would keep interest rates higher for longer. The report lands just two days before Fed Chair Warsh's Jackson Hole speech, potentially influencing his messaging.
The Bureau of Economic Analysis releases its second estimate of second-quarter GDP growth, along with updated figures for GDP consumer spending, the GDP price deflator, and PCE headline and core prices for Q2. This revision incorporates more complete data than the initial estimate and can sometimes shift the narrative around economic growth.
Second estimates can materially differ from advance readings, and markets have historically paid attention to significant revisions. The GDP report provides a broader view of economic activity beyond monthly indicators, helping investors assess the overall health of the economy.
The annual gathering in Jackson Hole, Wyoming, hosted by the Kansas City Federal Reserve, brings together roughly 120 central bankers, policymakers, and economists from over 70 countries. This year's theme is 'Financial Innovation: Implications for Payments and Policy.' Federal Reserve Chair Kevin Warsh will deliver his first keynote address as chair on Friday morning, August 28.
Jackson Hole keynotes have historically served as venues for Fed chairs to signal policy direction. Markets often scrutinize these speeches for hints about future monetary policy moves. Warsh, who took office in May 2026, has reduced forward guidance compared to his predecessor, making this speech particularly important for understanding his approach. A Bank of America survey showed 69% of fund managers anticipate a neutral tone, but any deviation could move markets.
The Bureau of Labor Statistics publishes its preliminary estimate of the annual benchmark revision to establishment survey employment data. Each year, the BLS benchmarks its monthly payroll estimates to comprehensive counts from the Quarterly Census of Employment and Wages (QCEW), which are derived from state unemployment insurance tax records. This revision can significantly alter the perceived strength of the labor market over the past year.
In past episodes, large benchmark revisions have reshaped the narrative around labor market momentum more than monthly prints themselves. Given that recent months have already seen downward revisions (May and June 2026 were revised down by a combined 103,000 jobs), this benchmark could meaningfully reshape the picture of how strong or weak 2025-2026 job growth actually was. Markets have historically treated large revisions as genuine event risk.
Earnings season continues with a focus on technology, retail, and consumer discretionary names. Nvidia's Wednesday after-close report is the marquee event, while retail earnings from Best Buy and Dollar Tree on Thursday provide insight into consumer spending patterns.
Nvidia is the world's most valuable company by market capitalization and a dominant player in AI accelerators. As a significant component of major indices, the company's quarterly results are typically watched closely by market observers. The stock has risen approximately 17.7% year-to-date to around $219 as of mid-August.
Best Buy is a major consumer electronics retailer whose results provide insight into consumer spending patterns on discretionary items. The company has faced headwinds in recent years, with revenues peaking in fiscal 2022 before gradually declining, though fiscal 2026 saw sales flatten out.
Dollar Tree operates discount retail stores and its results provide insight into value-conscious consumer behavior. The company is scheduled to report fiscal Q2 2026 results (quarter ended August 1, 2026).
A composite index that tracks overall economic activity across 85 indicators. Readings above zero indicate growth above historical trend.
The Conference Board's measure of consumer attitudes about current and future economic conditions. Historically, shifts in confidence can signal changes in consumer spending patterns.
Tracks the change in mortgage applications, providing insight into housing demand.
Measures the change in total income received by individuals. Rising income historically supports consumer spending.
Tracks consumer expenditure changes, which account for roughly two-thirds of U.S. economic activity.
The Federal Reserve's preferred inflation gauge. This is among the most closely watched economic indicators for monetary policy implications.
Excludes food and energy for a clearer view of underlying inflation trends. The Fed targets 2% core PCE inflation.
Updated estimate of economic growth incorporating more complete data than the advance reading.
A high-frequency indicator of labor market health. Rising claims historically signal labor market weakening.
Annual revision to payroll employment data based on comprehensive unemployment insurance records. Can significantly alter the perceived strength of job growth over the past year.
First Jackson Hole address by Chair Warsh. Historically, these speeches have provided important signals about monetary policy direction.
3.50% to 3.75%
September 15-16, 2026
Fed funds futures indicate approximately one-in-three odds of a rate hike at the September meeting, according to recent market pricing. The July 29 FOMC meeting held rates steady with a 9-3 vote, marking the first three-member dissent since September 2016, with three regional presidents voting in favor of a hike.
Ongoing
The ongoing conflict affecting the Strait of Hormuz has historically impacted global energy markets, as the waterway is a critical chokepoint for oil shipments. Developments in Iran-Oman talks or any escalation could affect oil prices and broader market sentiment.
7,674
Chartists have noted support levels around 7,640 and the 50-day moving average
The recent high of 7,816.70 from mid-August represents a level that technical analysts have identified
26,180
Technical analysts have identified support near the 26,000 level
The recent high near 26,803 from mid-August is a level chartists are watching
Technical analysis is one of many approaches used by market participants
Disclaimer: This week ahead preview is for educational purposes only and does not constitute investment advice. Scheduled events may be subject to change. Market reactions to events are unpredictable and past patterns do not guarantee future results. Always consult with a qualified financial advisor before making investment decisions.