
Market Analysis
Stock Market Today, Oct 14: CPI Report Due
Read Article
AI-powered insights into global financial markets
 StockCram Editorial12 min read
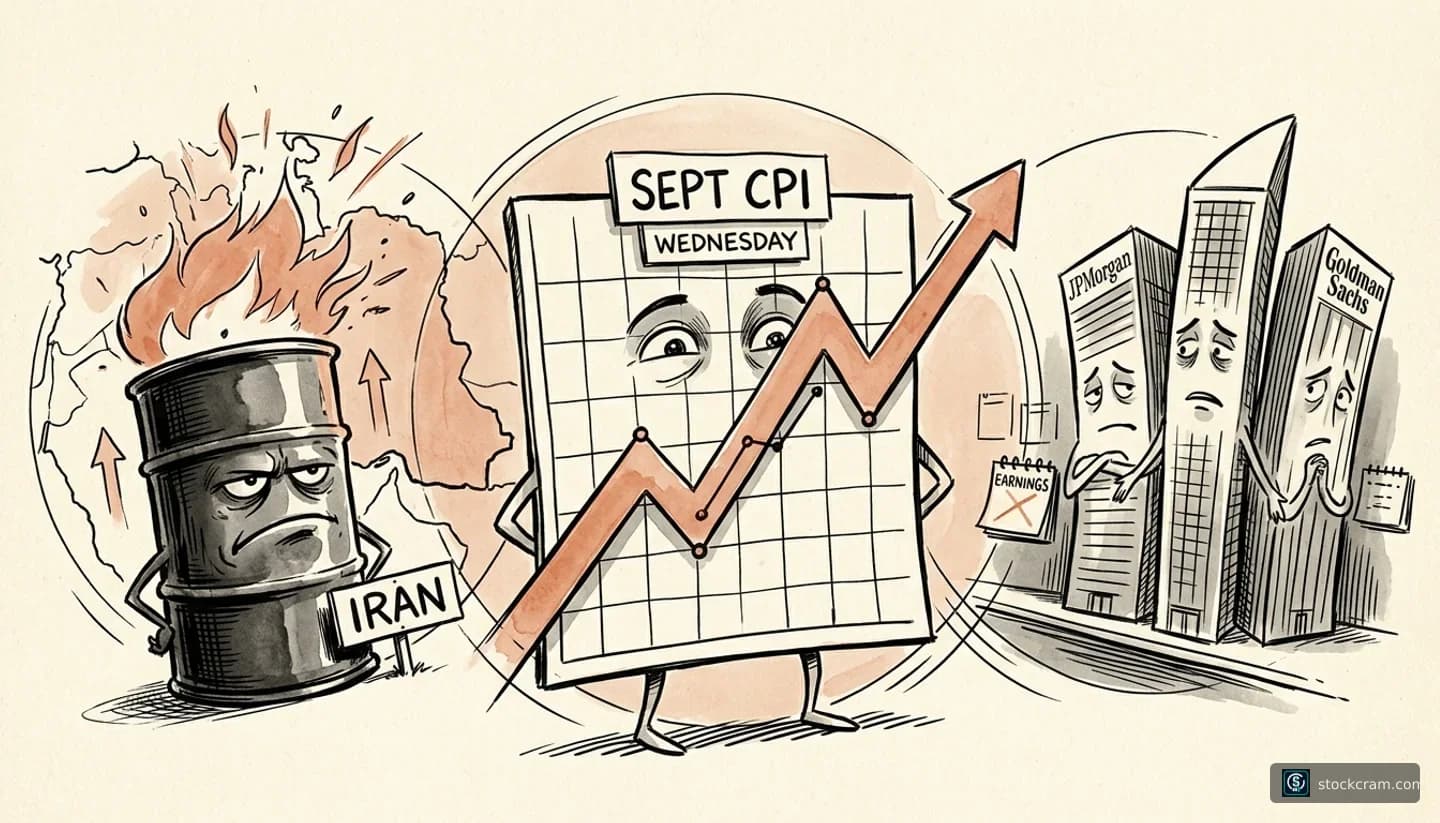
Inflation data drops Wednesday as oil prices swing on Iran war escalation and megabanks kick off earnings season—three forces that rarely align this tightly.
Week of Monday, October 12, 2026 - Friday, October 16, 2026
14.84
-3.70%
5.244%%
+0.21%
$$91.85
+0.39%
$$4,216.30
+1.43%
102.23
+0.09%
Markets closed Friday with the S&P 500 at 7,811.54, notching a weekly gain despite volatility tied to elevated Treasury yields and ongoing geopolitical uncertainty. The 10-year Treasury yield sits at 5.24%, near 24-year highs, while oil prices remain elevated following a week of intensified conflict in the Middle East, including a deadly Houthi strike on Riyadh airport that killed three people on October 9.
The S&P 500 finished the week up approximately 1.2% despite hitting fresh all-time highs earlier in the period. The Nasdaq Composite closed at 27,366, and the Dow at 51,655. The VIX volatility index settled at 14.84, down from earlier weekly highs.
Treasury yields at current levels historically signal investor expectations for sustained higher interest rates. The last time the 10-year yield exceeded 5.2% was in 2002, a period that preceded significant shifts in monetary policy and economic growth patterns.
Markets are open but bond markets are closed for Columbus Day. Cleveland Fed President Hammack delivers keynote remarks at the NABE Annual Meeting. No major economic data releases.
Earnings season begins in earnest with JPMorgan, Goldman Sachs, UnitedHealth, Johnson & Johnson, Wells Fargo, and Citigroup reporting before the open. NFIB Small Business Optimism data is released in the morning. Richmond Fed President Barkin speaks in the afternoon.
September CPI data arrives at 8:30 AM ET, followed by the Federal Reserve Beige Book at 2:00 PM. Bank of America, Morgan Stanley, and ASML report earnings before the open. Fed Governor Bowman speaks early in the morning.
September PPI, retail sales, and initial jobless claims are released at 8:30 AM ET. Taiwan Semiconductor reports earnings before the open. Industrial production data is also scheduled.
Housing starts and building permits data round out the week. No major earnings reports are scheduled from widely held companies.
October 9, 2026
Iran-aligned Houthi militants struck King Khalid International Airport in Riyadh on October 9, killing three people and damaging a Saudi Airlines plane, according to Saudi authorities. The attack comes amid broader escalation of the Iran war, with nine tankers attacked near the Strait of Hormuz in the past week and Saudi Arabia launching a military campaign to reclaim Houthi-controlled territories in Yemen. President Trump stated the U.S. would not attack Iran before the November midterm elections, temporarily easing immediate escalation fears.
Market Relevance
Oil markets have historically reacted sharply to supply disruptions in the Persian Gulf region. Brent crude closed at $104.28 per barrel on October 8, while WTI settled at $91.85 on October 9. The Strait of Hormuz typically handles over 20% of global oil trade, and reduced flows—currently about 30% below pre-war levels—have kept energy prices elevated throughout 2026, complicating central bank inflation efforts.
The conflict remains active, with fighting in Yemen reportedly killing over 270 people in a 24-hour period earlier in the week. Attacks on Red Sea shipping lanes through the Bab el-Mandeb Strait add a secondary chokepoint risk for global energy flows.
The CPI report measures changes in the prices consumers pay for goods and services. It is one of the primary indicators the Federal Reserve monitors when setting interest rate policy. September's reading arrives as energy costs have surged due to the Iran war, with gasoline prices averaging $4.09 per gallon nationally as of late July, though they have since moderated.
Historically, CPI readings that exceed expectations have prompted Treasury yields to rise and equity markets to sell off, as investors price in the possibility of more aggressive Federal Reserve tightening. The Fed raised rates by 25 basis points in September to a range of 3.75–4.00%, its first hike in three years, citing inflation that remains above the 2% target.
The PPI measures wholesale prices and often serves as a leading indicator for consumer inflation. Analysts watch for signs that cost pressures at the producer level are being passed through to consumers, which can signal whether inflation is becoming more entrenched.
Markets have historically paid close attention to PPI during periods of elevated inflation, as sustained wholesale price increases can translate into higher consumer prices and influence Federal Reserve policy decisions.
The retail sales report provides insight into consumer spending, which accounts for roughly two-thirds of U.S. economic activity. Economists are watching for signs of resilience or weakness in household consumption amid elevated interest rates and energy costs.
Strong retail sales during periods of high inflation and rising interest rates have historically surprised markets, as they suggest consumer demand remains robust despite tighter financial conditions.
The Beige Book is a summary of economic conditions across the twelve Federal Reserve districts, compiled from interviews with business contacts, economists, and market experts. It provides qualitative insight into regional economic trends and is published ahead of FOMC meetings.
Markets often scrutinize the Beige Book for anecdotal evidence of inflation pressures, labor market tightness, and economic growth, which can offer clues about the Fed's policy trajectory.
Third-quarter earnings season kicks off this week with major financial institutions reporting, followed by key technology and healthcare names. The reporting period arrives as analysts forecast S&P 500 earnings growth of approximately 29.5% for Q3 2026, which would mark the third consecutive quarter of growth above 25%.
JPMorgan is the largest U.S. bank by assets and a bellwether for the financial sector. The bank has been the top earner from IPO fees in 2026 thus far. As a major component of the Dow Jones Industrial Average and S&P 500, its results are closely watched by market participants.
Goldman Sachs is a leading global investment bank. Its trading and investment banking divisions provide insight into capital markets activity and institutional investor sentiment.
UnitedHealth is the largest health insurer in the United States and a significant component of the Dow. The company has raised its full-year outlook at each of its past three quarterly reports, though shares have underperformed the broader market recently.
Johnson & Johnson is a diversified healthcare company with pharmaceutical, medical device, and consumer health divisions. It is a Dow component and considered a defensive stock.
Wells Fargo is one of the largest U.S. banks by assets and a major mortgage lender. Its results provide insight into consumer banking trends and housing market activity.
Citigroup has significant international operations and provides a window into global banking trends and emerging market activity.
Bank of America is the second-largest U.S. bank by assets and has substantial consumer banking and wealth management operations.
Morgan Stanley has a large wealth management business alongside its investment banking and trading operations.
TSMC is the world's largest contract chipmaker and a critical supplier to major technology companies. Its results provide insight into semiconductor demand and the health of the technology supply chain, particularly for AI-related chips.
ASML is the sole supplier of extreme ultraviolet (EUV) lithography equipment essential for manufacturing advanced semiconductors. Its order book is watched as a leading indicator for chip industry capital spending.
Bond markets are closed, but stock markets remain open. No major economic data releases are scheduled.
Hammack is a 2026 voting member of the FOMC and has been among the more hawkish voices on the committee. Remarks from voting members are closely monitored for clues about the path of <a href="/learn/terms/federal-reserve">interest rates</a>.
This survey measures sentiment among small business owners and includes questions about hiring plans, sales expectations, and economic conditions.
Barkin is not a voting member in 2026 but rotates into a voting seat in 2027. His recent remarks have emphasized that inflation risks outweigh employment risks.
Bowman is a voting member and Vice Chair for Supervision. Her remarks are typically focused on banking regulation, though she has been supportive of rate increases to combat inflation.
Headline CPI is expected to remain elevated due to higher gasoline prices tied to the Iran war. Core CPI, which excludes food and energy, is watched for signs of broader inflation trends.
Core inflation strips out volatile food and energy prices and is often considered a better gauge of underlying inflation trends.
The Beige Book provides qualitative insights into economic conditions across Fed districts and is published two weeks before each FOMC meeting.
The PPI measures wholesale prices and can signal future consumer price trends. Energy costs are expected to remain a key driver.
Core PPI excludes food and energy and is watched for signs of persistent cost pressures at the wholesale level.
Retail sales provide a timely read on consumer spending, which drives roughly two-thirds of U.S. economic activity.
Weekly jobless claims are monitored for signs of labor market weakening or resilience.
Industrial production measures output from factories, mines, and utilities and provides insight into the manufacturing sector.
Housing data is watched for signs of how elevated mortgage rates are affecting residential construction activity.
3.75% to 4.00%
October 27–28, 2026
Fed funds futures pricing as of mid-October indicates roughly 20% odds of a 25-basis-point rate increase at the October meeting and 70–80% odds of a hike by the December meeting, according to market commentary. The September FOMC minutes showed most officials favor another rate increase by year-end.
October 12–18, 2026
The meetings bring together finance ministers and central bankers from around the world. Discussions often touch on global growth, inflation, and monetary policy coordination, which can influence investor sentiment.
Tuesday, October 13
The RBA's policy deliberations are watched for insights into how central banks in commodity-exporting economies are navigating inflation and growth trade-offs.
Wednesday, October 14
China's inflation and trade figures provide insight into demand conditions in the world's second-largest economy and can affect global commodity prices and supply chain dynamics.
7,811.54
Chartists have noted support around the 7,750–7,775 area
Recent all-time highs near 7,820 represent a psychological resistance level
27,366
The 27,000 level has been cited by technicians as a near-term support zone
Resistance is observed near recent highs around 27,500
Technical analysis is one of many approaches used by market participants and should be considered alongside fundamental and macroeconomic factors.
Disclaimer: This week ahead preview is for educational purposes only and does not constitute investment advice. Scheduled events may be subject to change. Market reactions to events are unpredictable and past patterns do not guarantee future results. Always consult with a qualified financial advisor before making investment decisions.